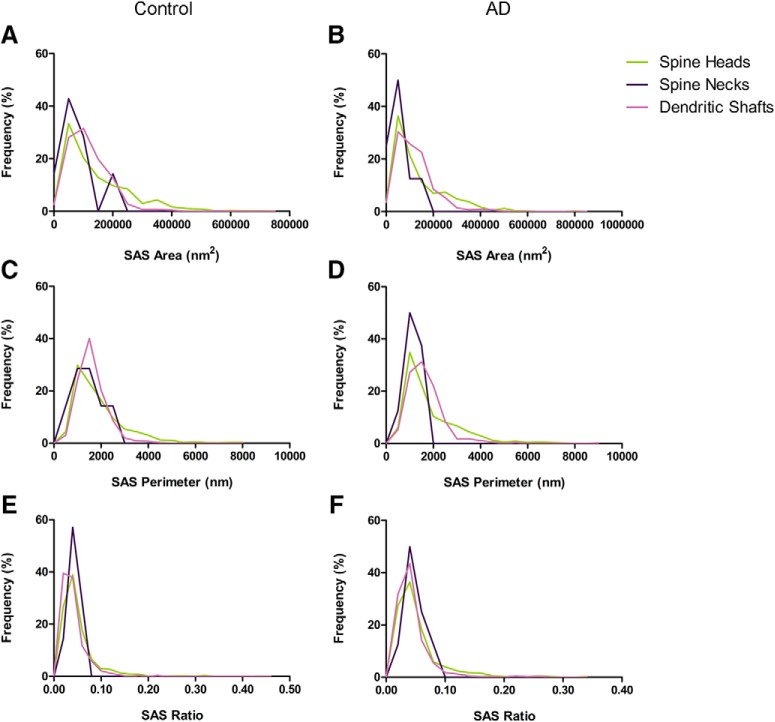
Figure 6.
Frequency histograms of the SAS area (A, B), perimeter (C, D), and curvature (E, F) of AS targeting spine heads, spine necks, and dendritic shafts from control cases (A, C, E) and from AD patients (B, D, F). The mean SAS curvature ratio of synapses targeting spine heads was significantly higher than in synapses targeting dendritic shafts (KW, p < 0.0001), both in control cases and AD patients.

