Figure 1.
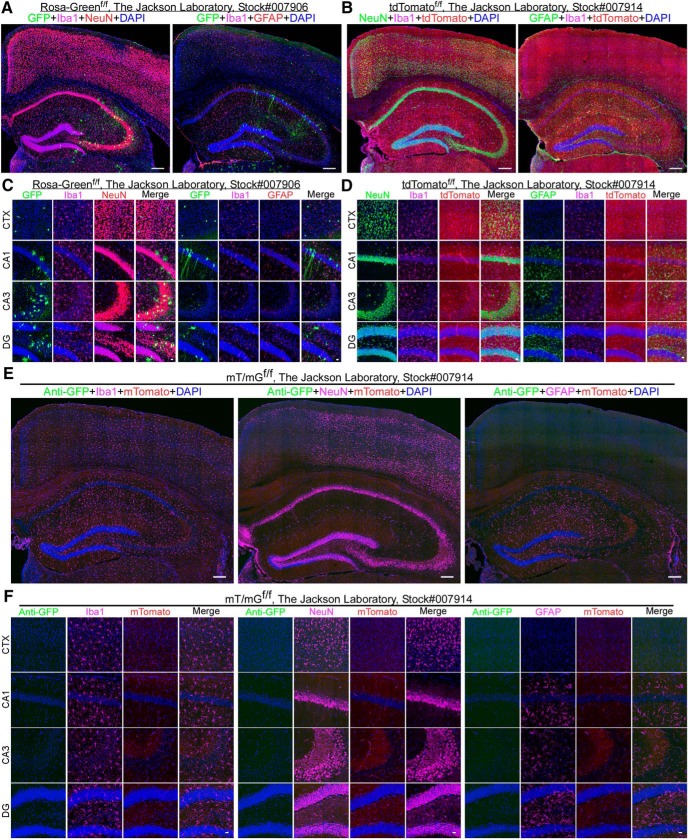
Leakage of fluorescent reporter lines. A, Full montage of confocal images showing GFP expression in the cortex and hippocampus of the Rosa-Greenf/f mouse line. Mouse brain sections were stained with: goat anti-Iba1 (pink), rabbit anti-NeuN (red) or chicken anti-GFAP (red), and DAPI (blue). Scale bar, 200 μm. B, Full montage of images showing tdTomato expression in the cortex and hippocampus of the tdTomatof/f mouse line. Mouse brain sections were stained with: rabbit anti-Iba1 (pink), mouse anti-NeuN (green) or chicken anti-GFAP (green), and DAPI (blue). Scale bar, 200 μm. C, High-magnification images showing that the morphology of GFP-positive cells varies among anatomic regions in the cortex (CTX) and the hippocampal CA1, CA3, and DG in Rosa-Greenf/f mice. Scale bar, 20 μm. D, High-magnification images showing tdTomato-positive cells in the CTX and the hippocampal CA1, CA3, and DG in tdTomatof/f mice. Scale bar, 20 μm. E, Full montage of confocal images indicating no GFP-positive cells in the CTX and the hippocampus of the mT/mGf/f mouse line. Mouse brain sections were stained with: rabbit anti-GFP (green), goat anti-Iba1 (pink) or mouse anti-NeuN (pink) or chicken anti-GFAP (pink), and DAPI (blue). Scale bar, 200 μm. F, High-magnification images no GFP-positive cells in the CTX and the hippocampal CA1, CA3, and DG in the mT/mGf/f mouse line. Scale bar, 20 μm. Also see Extended Data Fig. 1-1, Fig. 1-2, Fig.1-3.

