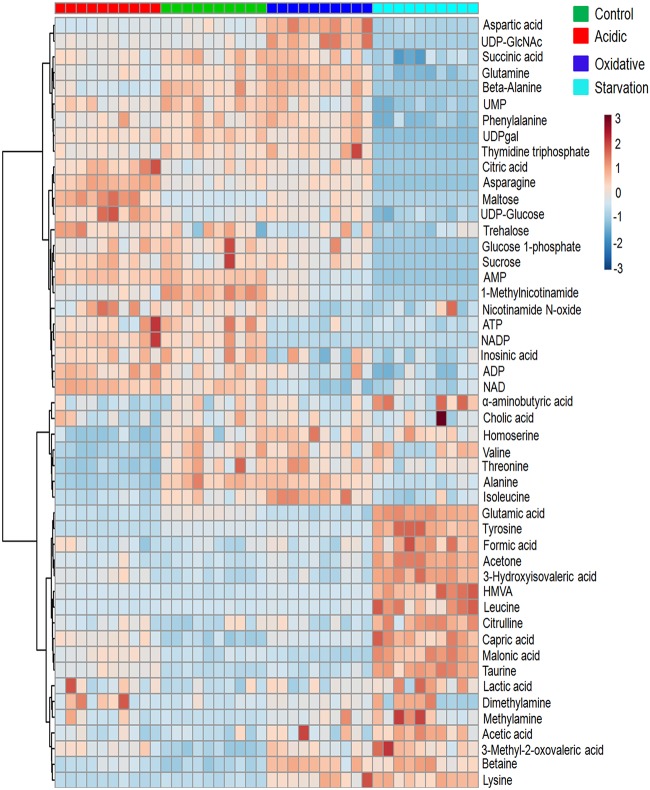
FIG 1.
Heat map representation of the metabolic changes in M. smegmatis upon exposure to acidic stress, oxidative stress, and nutrient starvation compared to the control. Each row represents a single metabolite detected in the study. Color differences demonstrate the relative concentrations of metabolites across the different conditions and experiment groups. Individual samples (horizontal axis) and metabolites (vertical axis) are separated using hierarchical clustering (Ward’s algorithm), with the dendrogram scaled to represent the distance between each branch (Pearson’s correlation). From each group, 10 biological samples were analyzed. Dark-orange color in a the tile indicates high levels, and dark blue indicates low levels. HMVA, 2-hydroxy-3-methyl valeric acid.

