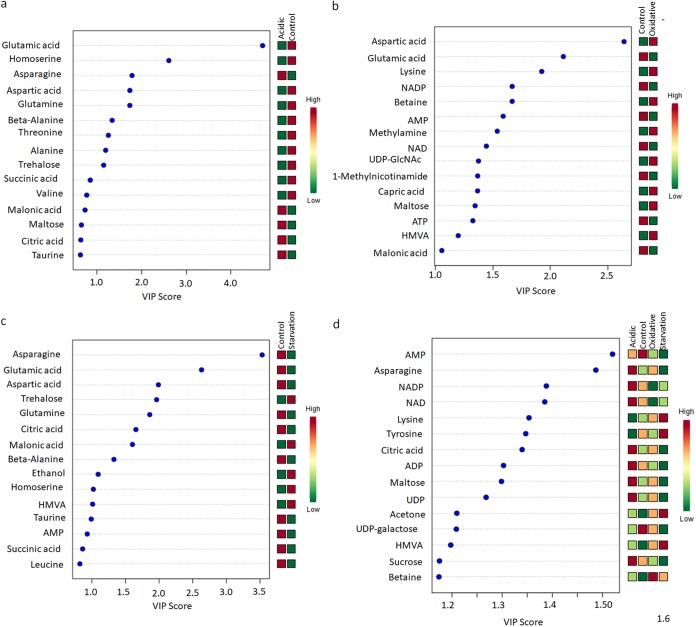
FIG 2.
Variable importance in projection (VIP) plots with the top 15 discriminating metabolites identified through PLS-DA analyses in descending order of importance. (a) Acidic stress versus the control. (b) Oxidative stress versus the control. (c) Nutrient starvation versus the control. (d) Acidic, oxidative, and nutrient starvation versus the control. The colored boxes on the right indicate the relative concentrations given on a scale of high (red) to low (green) for the corresponding metabolites in each group.

