FIG 1.
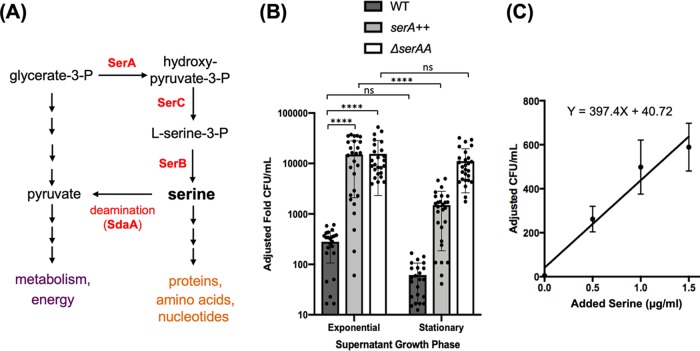
Supernatants of B. subtilis cells support growth of a serine auxotroph. (A) Serine metabolism is linked to central metabolism through glycerate-3-phosphate (G-3-P). G-3-P is a precursor for serine biosynthesis through the activities of SerA, SerC, and SerB. SerA carries the rate-limiting step in serine biosynthesis. The SdaA deaminase complex is involved in converting serine back to G-3-P. (B) Microbiological assays were used to assess serine levels in the supernatant. Supernatants from three different strains (WT, JG08 [serA overexpression], and JG59 [ΔsdaAA]) grown in MSgg medium were prepared during exponential phase (OD600, ∼0.6) and early stationary phase (OD600, ∼1.4) to mimic biofilm entry. Auxotroph cultures, ΔserA (YC913), were washed and subcultured for growth into the supernatants and then plated for CFU counts. Adjusted fold CFU was defined as fold changes of CFU and calculated by comparing the CFU of the serine auxotroph strain after growth in the supplemented supernatant to the CFU of the initial inoculum. As shown, exponential-phase supernatant from cells with serA overexpression (serA++, JG08) was able to support growth about 10 times better than stationary-phase supernatant (****, P ≤ 0.0001). Also, adding supernatant from significantly increased population growth during exponential phase compared with stationary phase from cells with a deleted sdaAA gene (JG59) (*, P ≤ 0.05). Supernatant did not show a significant decrease in cell growth from wild-type supernatant in stationary compared with exponential stage (ns, P > 0.05). Exponential-phase supernatants of both JG08 and JG59 supported much higher growth of the auxotroph than the exponential-phase supernatant of the wild type (****, P ≤ 0.0001), indicating the effectiveness of genetic manipulation in increasing cellular serine accumulation. Dots represent individual data points. Error bars represent standard deviations. (C) Standard curve of ΔserA strain (YC913) in MSgg growth medium supplemented with different concentrations of serine. After 24 h of incubation, YC913 cells were plated, and CFU were counted the next day. CFU count was adjusted to the CFU of initial inoculum to get the adjusted fold CFU per milliliter. The best-fit curve has equation y = 397.40x + 40.72 (R = 0.9626) and can be used to better estimate the concentration of serine in the harvested supernatant. Error bars represent standard deviations.

