FIG 5.
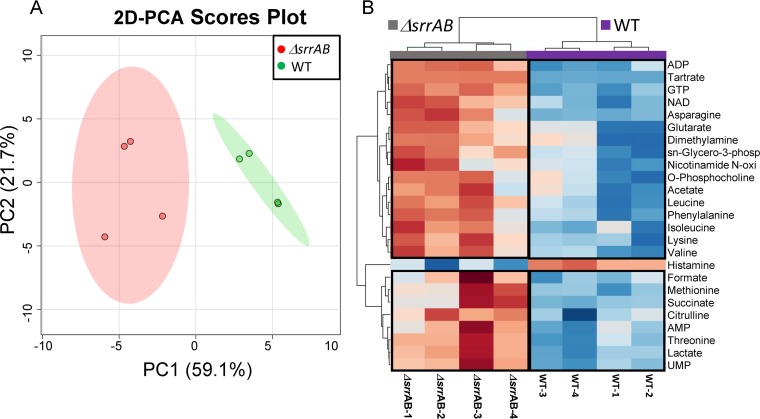
2D-PCA score plot and hierarchical clustering analysis (HCA) of the metabolite profiles of the ΔsrrAB and WT strains following aerobic growth for 48 h. (A) The 2D-PCA score plot separates the metabolic profile of ΔsrrAB (JMB 1467) from that of WT (JMB 1100), with PC1 and PC2 accounting for 59% and 22% of the variance, respectively. (B) Heat map visualization of the top 25 metabolites whose level changes contributed the separation between the ΔsrrAB and WT groups. Boxed regions indicate metabolites whose levels were higher (red) or lower (blue) when comparing the ΔsrrAB and WT groups, using a relative metabolite abundance scale of +2 (red) to −2 (blue). Most of the metabolites contributing to the separation between the two groups were in higher relative abundance in the ΔsrrAB strain than in the WT strain. sn-Glycero-3-phosp, sn-glycero-3-phosphocholine; Nicotinamide N-oxi, nicotinamide N-oxide.

