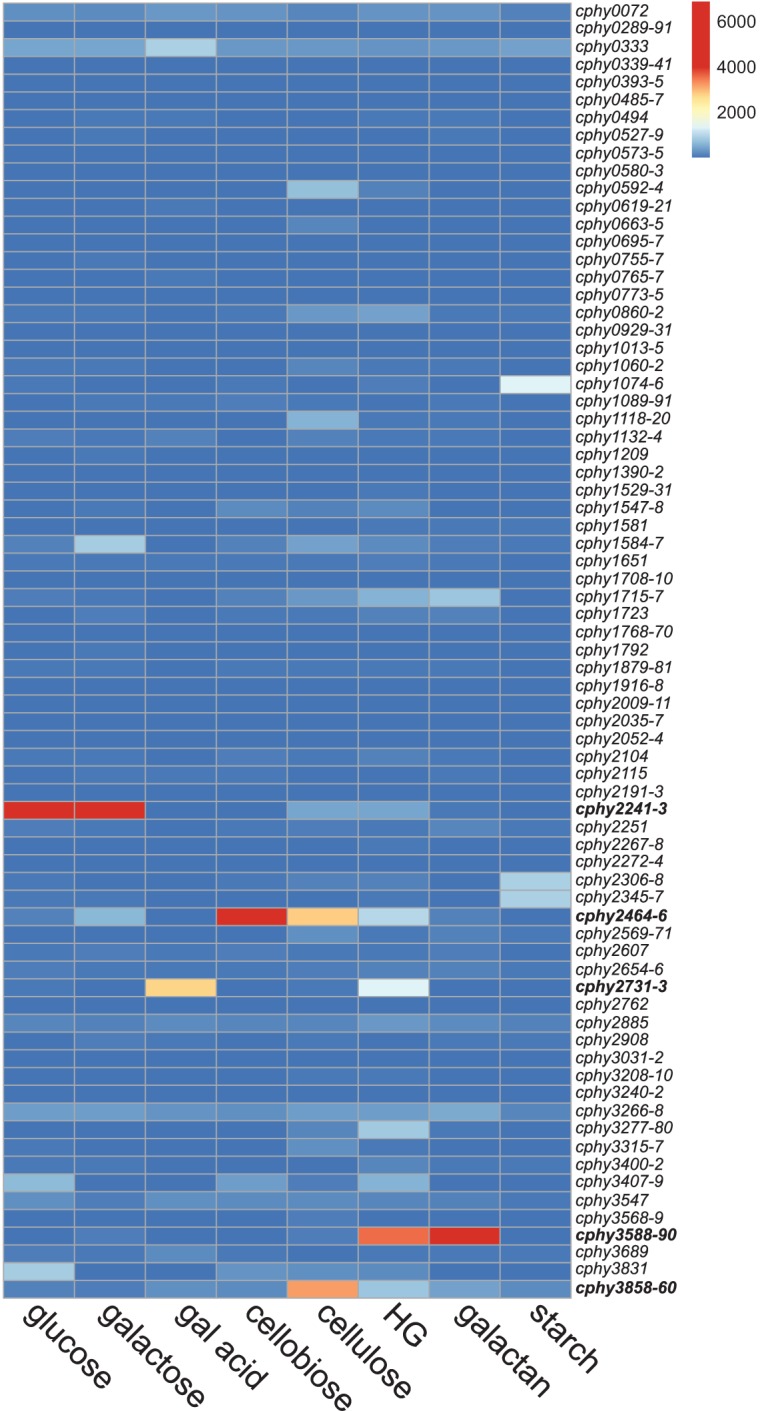
FIG 1.

C. phytofermentans upregulates transcription of specific sugar transporters on each carbon source. The heat map is colored based on the mRNA expression measured by RNA-seq of the 173 transporter genes predicted to uptake sugars by TransportDB. Expression is reported as mean RPKM (reads per kilobase per million) mapped reads from duplicate cultures. Genes are described using NCBI GenBank gene numbers (GenBank accession number CP000885.1). Transporter genes coexpressed as an operon are shown on a single row as the average expression of all genes in the operon. Hexose-responsive ABC transporters prioritized for gene inactivation are in bold. gal acid, galacturonic acid; HG, homogalacturonan.
