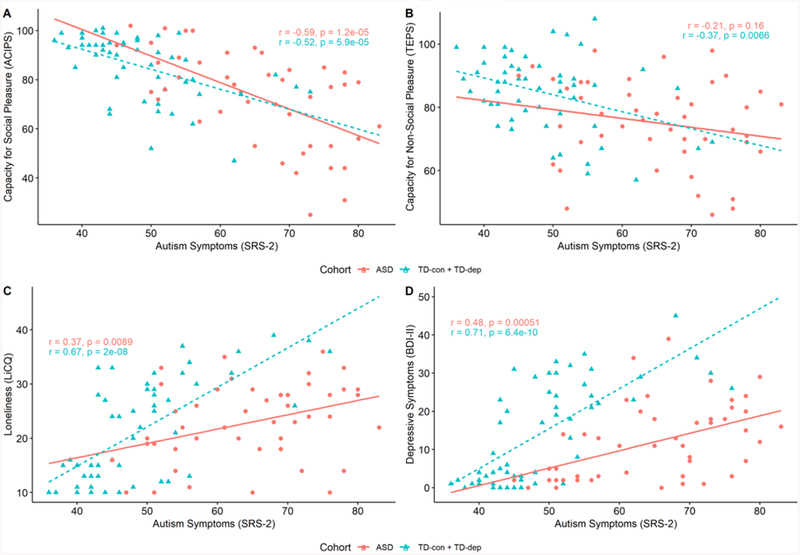
Figure 2.
Bivariate Relations Between Autism Traits and Primary Measures
Note. Scatter plots and fitted regression lines for the combined TD cohort (TD-con + TD-dep) and ASD cohort are provided in teal hatched line and red solid line, respectively, to depict the relationship between autism symptoms (SRS-2) and (A) capacity for social pleasure (ACIPS), (B) capacity for non-social pleasure (TEPS), (C) loneliness (LiCQ), and (D) depressive symptoms (BDI-II). Pearson correlations and significance values are also provided in each panel for each group.

