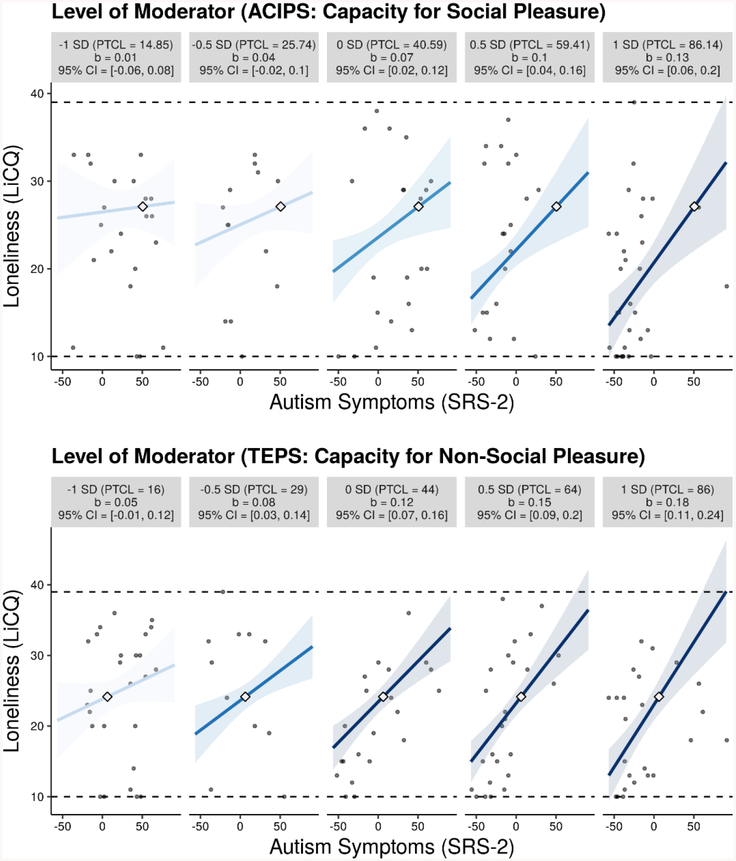
Figure 3.
Moderating Role of Capacity for Non-Social and Social Pleasure in the Relationship Between Autism Symptoms and Loneliness
Note. Interaction plots were created using interActive, an interaction visualization application in R (R Developmental Core Team, 2016) created by McCabe, Kim, and King (2018). Several simple slopes are presented for levels of the moderator at 1 SD and .5 SD below the mean, at the mean, and .5 SD and 1 SD above the mean to depict the change in association between autism symptoms (SRS-2) and loneliness across multiple levels of the moderator. For interpretability, SRS-2, ACIPS, and TEPS were centered. Each graphic shows the observed data (grey dots), maximum and minimum values of outcome (dashed horizontal lines), coefficient of the simple slope and 95% confidence region (shaded area), and the crossover point (diamond). The x-axes represent the full range of centered SRS-2 scores.

