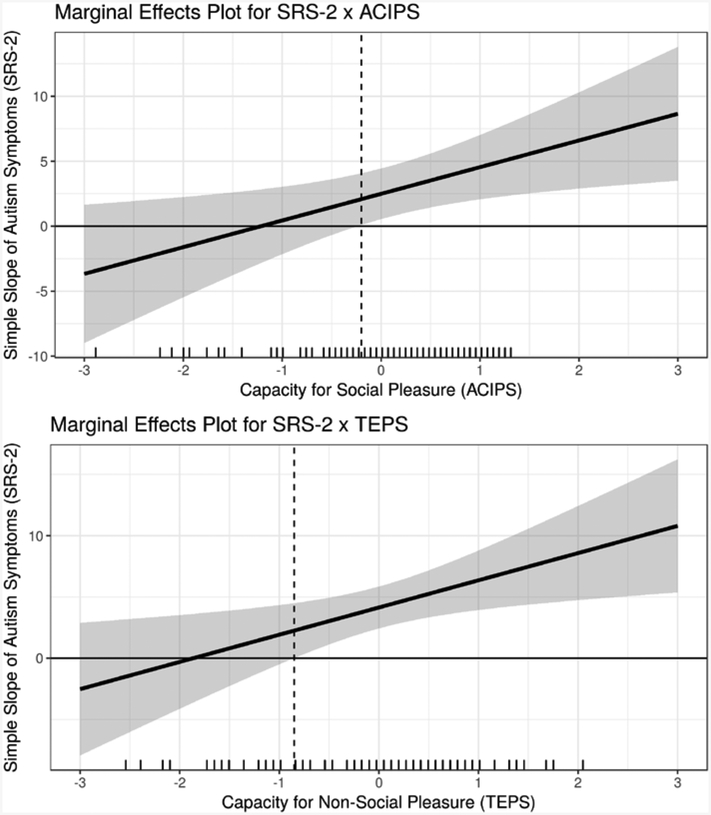
Figure 4.
Marginal Effects Plots Depicting Regions of Significance of the SRS-2 X TEPS and SRS-2 X ACIPS Interaction Effects
Note. The marginal-effects plots were created using interActive (McCabe, Kim, and King, 2018) and show the marginal effect of autism symptoms (SRS-2) on loneliness (i.e., the simple slopes of SRS-2 for each interaction effect) across a range of the moderator variables (i.e., ACIPS and TEPS). The shaded areas represent the 95% confidence regions for the marginal effects. Further, the plots also include a marginal rug of the moderators on the horizontal axis that indicates the frequency of observed values of the moderators across the range of the horizontal axis. For the SRS-2 x; ACIPS interaction, the simple slope of SRS-2 on LiCQ is significant and positive when the ACIPS score is −0.20 standard deviations away from the mean or greater; 62% of ACIPS observations are within this region. For the SRS-2 x TEPS interaction, the simple slope of SRS-2 on LiCQ is significant and positive when the TEPS score is −0.85 standard deviations away from the mean or greater; 77% of observed TEPS scores are within this region.

