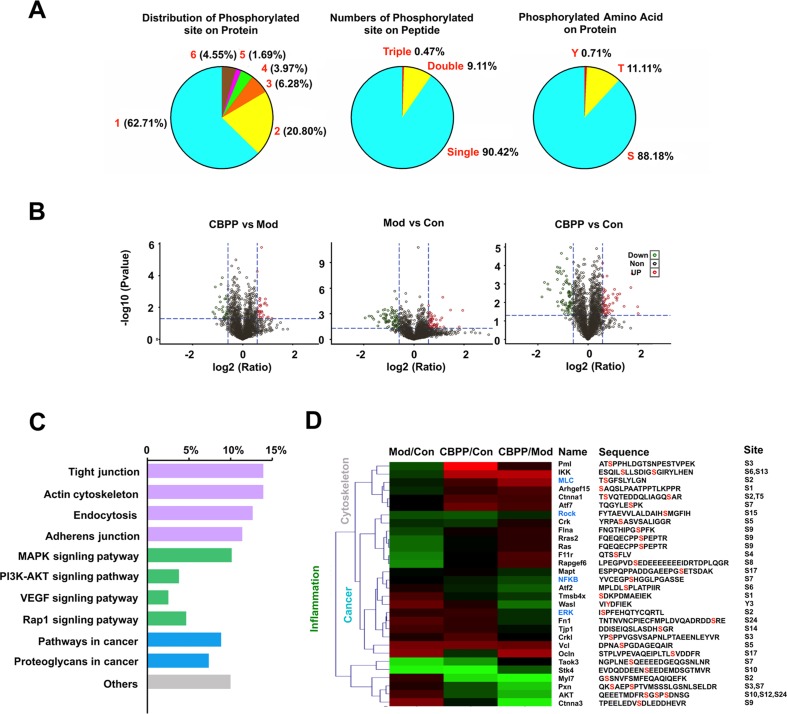
Figure 2.
ITRAQ-based quantitation phosphoproteomics analysis of lung tissue. (A) Identification of phosphoproteome and displayed the information of phosphorylation of the protein, peptide, and amino acid. (B) Quantitation of phosphoproteome in volcano plots, satisfy multiple differences log2 ratio ≤ 1.3 or ≥0.667 and P-value ≤0.05; red dots: upregulated; green dots: downregulated. (C) The analysis of signaling pathways and function of significant phosphorylated peptides. (D) The heat map analysis of proteins related with inflammation, cancer, and the cytoskeleton, as well as information of identified phosphorylated peptide.

