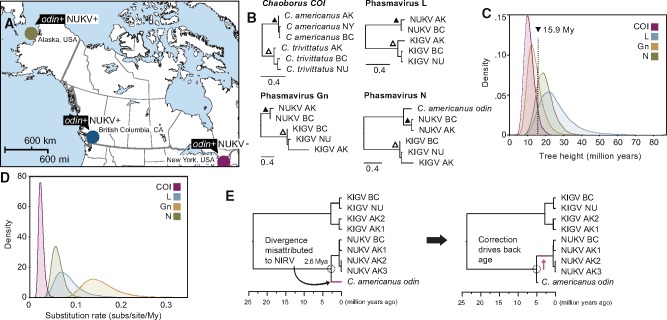
Figure 4.
Molecular evolution of Chaoborus phasmaviruses and odin. (A) A map of North America shows collection sites and NUKV infection status of Chaoborus americanus. (B) Maximum likelihood phylograms for host and phasmavirus genes. Nodes that were calibrated to 0.7 and 2.67 My based on COI sequence divergence are marked with filled and hollow triangles, respectively. Note that odin was not present in the N alignment used for virus divergence and rate estimation. Scale bars display nucleotide distance. (C) Marginal density plots of tree heights for each gene tree in panel B following BEAST divergence analysis. Distributions for all loci overlap between 10 and 20 My, indicating virus and host have been diverging for similar timescales. (D) Marginal density plots of substitution rates estimated during BEAST divergence analysis show rates 3–10 times faster than the host mitochondrial gene, indicating a relatively slow long-term evolutionary rate for phasmaviruses. (E) The Bayesian consensus tree following BEAST divergence time analysis of phasmavirus N sequences and the odin gene displays an integration estimate of ∼2.6 My. Because this analysis did not account for the slowed evolutionary rate of odin after integration, the second tree illustrates that the effect of correcting for equal rates is to drive the true odin acquisition date further into the past.

