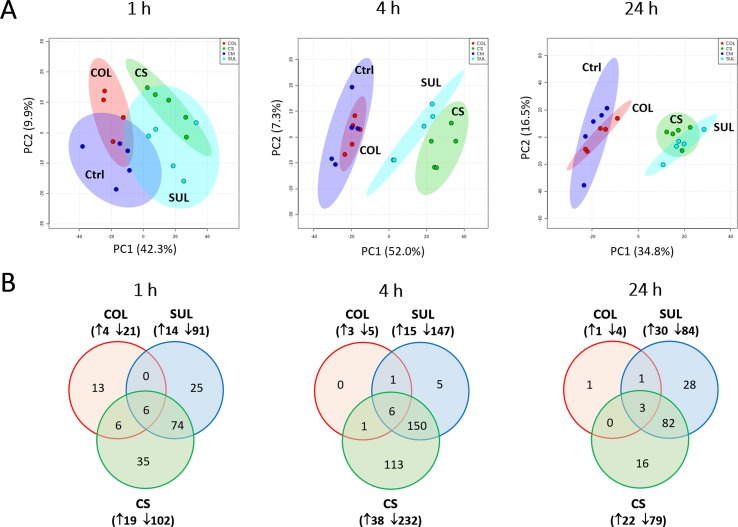
Figure 1.
Multivariate and univariate analyses of global metabolic changes. (A) Principal component analysis (PCA) score plots of the first two principal components for metabolite levels in A. baumannii AB090342 after treatments with colistin alone, sulbactam alone, and the combination at 1, 4, and 24 h. Each dataset represents a total of 20 samples with five biological replicates under each condition. Blue = untreated control (Ctrl); red = colistin alone (COL); cyan = sulbactam alone (SUL); green = the combination (CS). (B) Venn diagrams show the number of significantly affected metabolites by each treatment at 1, 4, and 24 h. Significant metabolites were selected based on false discovery rates (FDR) < 0.05 and |log2FC| ≥ 1 (one-way ANOVA). The up and down arrows indicate metabolites that were significantly increased and decreased, respectively.

