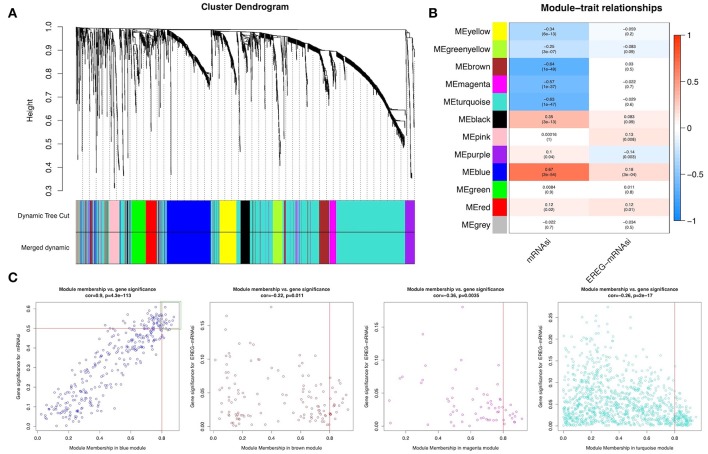
Figure 2.
Weighted gene co-expression network of bladder urothelial cancer. (A) Identification of a co-expression module in bladder urothelial cancer. The branches of the cluster dendrogram correspond to the 11 different gene modules. Each piece of the leaves on the cluster dendrogram corresponds to a gene. (B) Correlation between the gene module and clinical traits, including mRNAsi and EREG-mRNAsi. The correlation coefficient in each cell represented the correlation between the gene module and the clinical traits, which decreased in size from red to blue. The corresponding P-value is also annotated. (C) Scatter plot of module eigengenes in the blue, brown, magenta, and turquoise modules.

