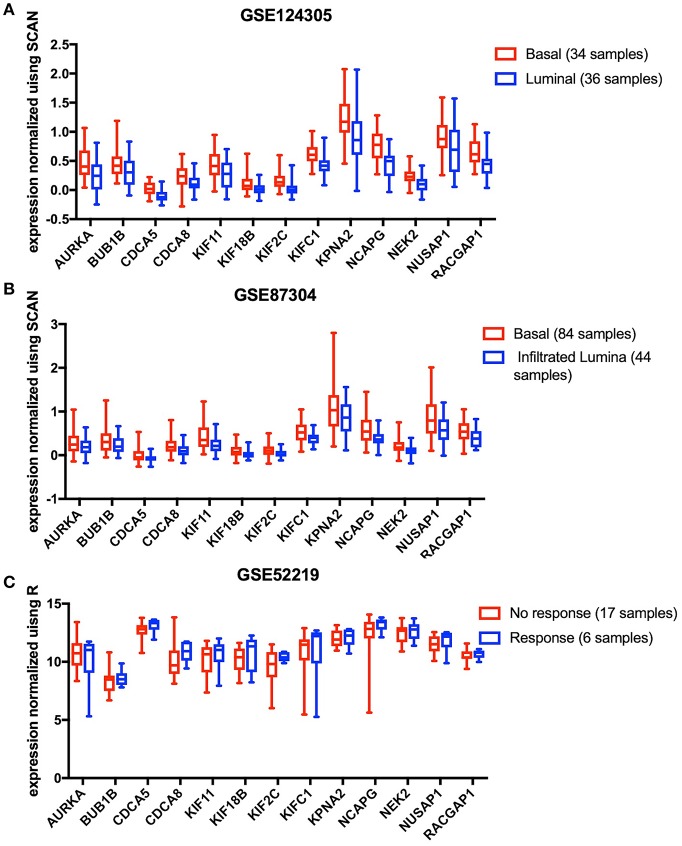
Figure 4.
The 13 key genes were verified in the GEO database, and the statistical analysis was performed using the t-test or Mann-Whitney U-test. (A) In GSE124305, expression of the 13 key genes was higher in the basal subtype than the Luminal subtype. (B) In GSE87304, expression of the 13 key genes was higher in the basal subtype than the infiltrated Luminal subtype. (C) After neoadjuvant chemotherapy, 13 key genes did not differ between the response and no response groups.

