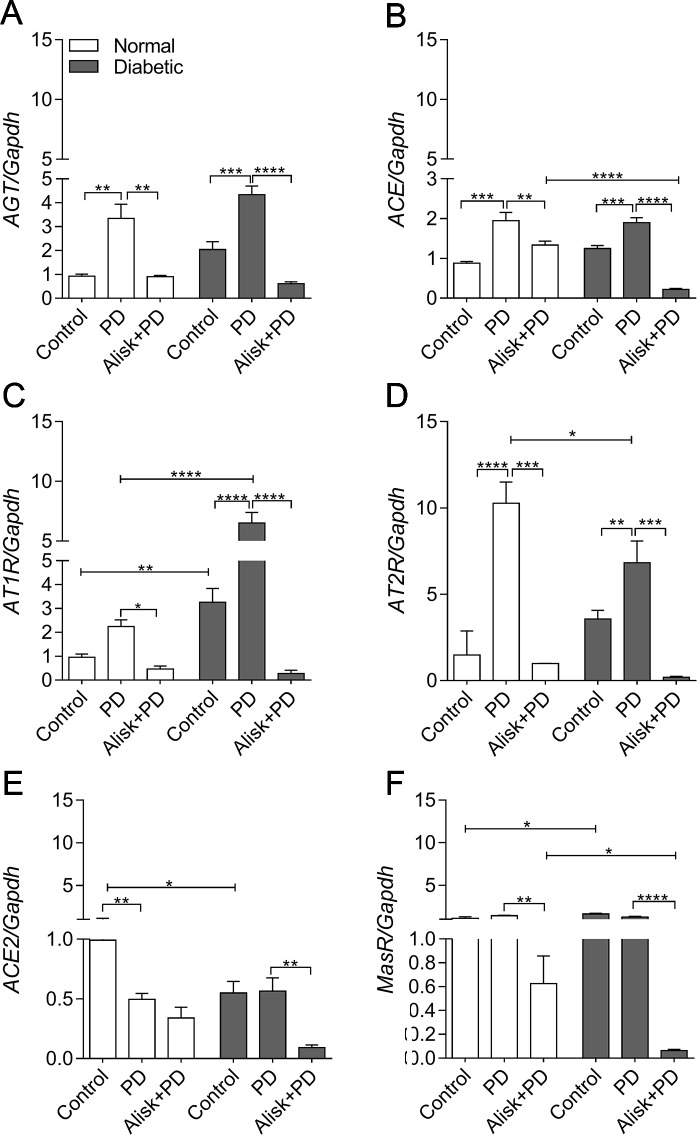
Figure 3.
AGT, ACE, AT1R, AT2R, ACE2, and MasR gene expression of gingival tissue from normal and diabetic mice 14 days after PD. (A) AGT, (B) ACE, (C) AT1R, (D) AT2R, (E) ACE2, and (F) MasR in gingival tissue of control, normal mice with PD (PD), normal mice with PD treated with aliskiren (Alisk + PD), control, diabetic mice with PD (PD), diabetic mice with PD treated with aliskiren (Alisk + PD) by real-time RT-PCR. Results express mean ± SEM, normalized by fold change. Significant values are represented by *p < 0.001, **p < 0.05, ***p < 0.005, and ****p < 0.0001 (Control vs. PD, PD vs. Alisk+ PD, PD vs. PD, PD+Alisk vs. PD+Alisk).

