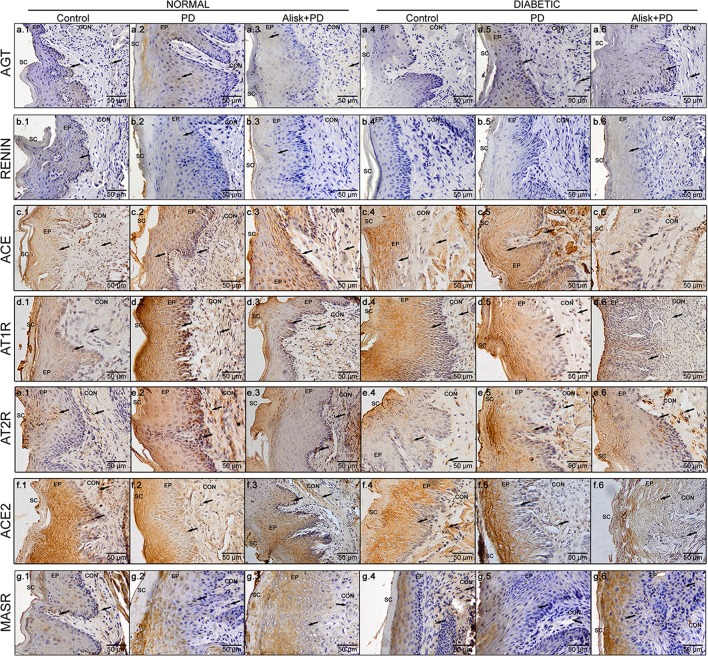
Figure 4.
Immunoreactivity for AGT, renin, ACE, AT1R, AT2R, ACE2, and MasR in gingival tissue of normal and diabetic mice 14 days after PD. AGT production of normal mice (a.1 control, a.2 with PD, and a.3 with Alisk + PD) and diabetic mice (a.4 control, a.5 with PD, and a.6 with Alisk + PD); Renin production of normal mice (b.1 control, b.2 with PD, and b.3 with Alisk +PD), and diabetic mice (b.4 control, b.5 with PD, and b.6 with Alisk+PD); ACE production of normal mice (c.1 control, c.2 with PD, and c.3 with Alisk + PD), and diabetic mice (c.4 control, c.5 with PD, and c.6 with Alisk + PD); AT1R production of normal mice (d.1 control, d.2 with PD, and d.3 with Alisk +PD), and diabetic mice (d.4 control, d.5 with PD, and d.6 with Alisk+PD); AT2R production of normal mice (e.1 control, e.2 with PD, and e.3 with Alisk + PD), and diabetic mice (e.4 control, e.5 with PD, and e.6 with Alisk + PD); ACE2 production of normal mice (f.1 control, f.2 with PD, and f.3 with Alisk +PD), and diabetic mice (f.4 control, f.5 with PD, and f.6 with Alisk+PD); MasR production of normal mice (g.1 control, g.2 with PD, and g.3 with Alisk +PD), and diabetic mice (g.4 control, g.5 with PD, and g.6 with Alisk+PD). All images are at 20× magnification, and scale bars indicate a distance of 50 µm. Brow staining indicates positive IR. Abbreviations: sc, superficial cells; ep, epithelium; BL, basal cell layer; LP, lamina propria.

