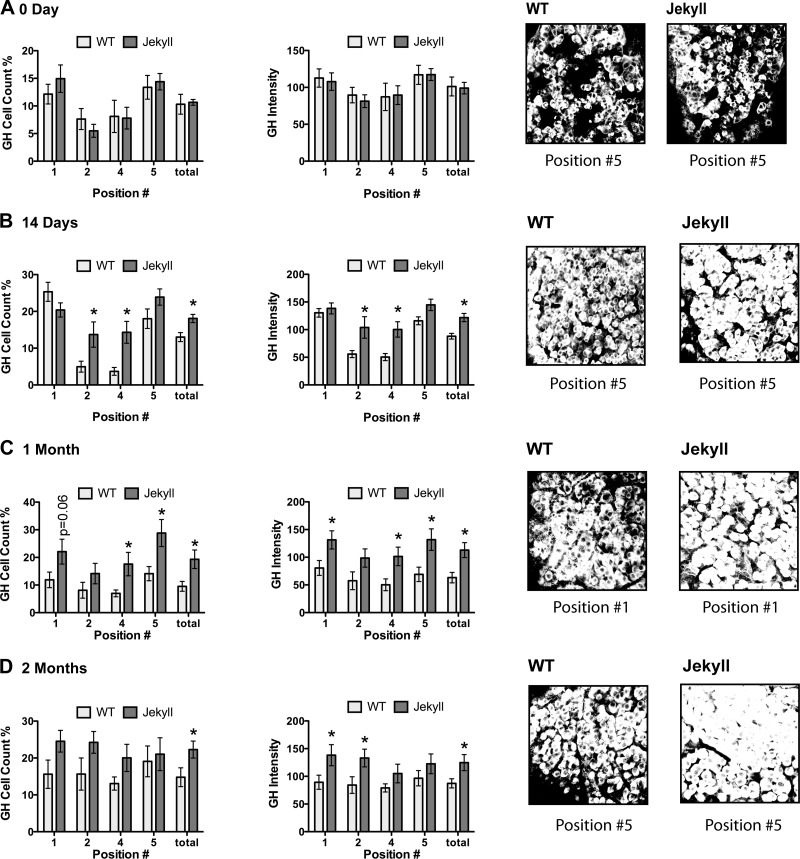
Fig. 3.
Quantifying somatotrope number and GH content. Somatotrope number and fluorescent intensity (i.e., GH content as optical density units) were quantified in pituitaries from 0-, 14-, 30-, and 60-day-old WT and Jekyll mice (histograms). Significant differences between means of each region are indicated by asterisks (n = 8, P ≤ 0.05 determined by two-way ANOVA) and P values for other noted comparisons are shown. Numbers on x-axes correspond to pituitary regions imaged (Fig. 1) and “total” represents the entire pituitary. Also included are representative images (×200) of the indicated positions. GH, growth hormone; WT, wild-type.

