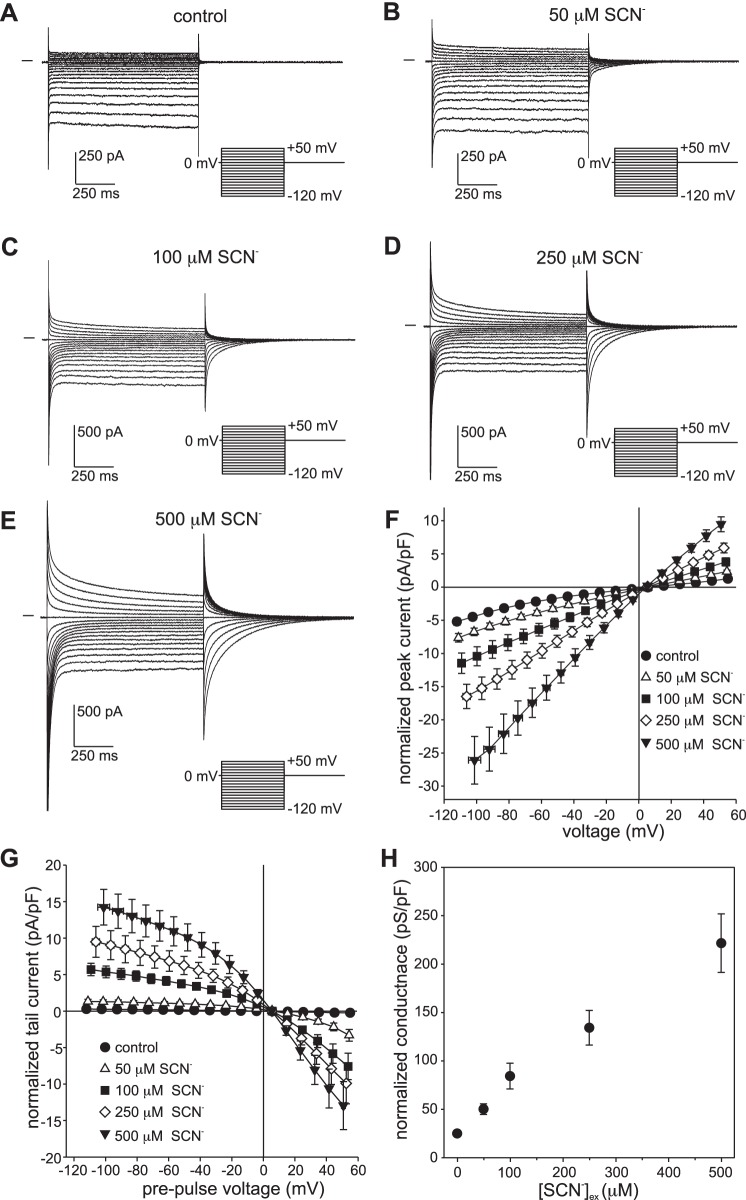
Fig. 1.
Dependence of whole cell currents in isolated mouse retinal pigment epithelial (RPE) cells on external thiocyanate (SCN−) concentration ([SCN−]ex). A–E: families of whole cell currents were recorded in the same cell in the presence of 0 µM (A), 50 µM (B), 100 µM (C), 250 µM (D), or 500 µM SCN− (E). The pipette and bath solutions contained 140 mM Cl− and 145.6 mM Cl−, respectively. Currents were evoked from a holding potential of 0 mV by a series of voltage steps in the range of −120 mV to +50 mV. The interval between the start of voltage steps was 3 s. The horizontal trace to the left of each family of currents represents the zero-current level. F: dependence of instantaneous current amplitude on [SCN−]ex. Currents were normalized by membrane capacitance, and membrane voltage was corrected for liquid junction potentials and the voltage drop across series resistance (Rs). Symbols represent means and bidirectional error bars represent SE (n = 5–7 cells from 3 C57BL/6J mice); where not visible, the error bars are smaller than the symbols. The mean current at each SCN− concentration is significantly larger than control at all voltages in the ranges of −100 mV to −30 mV and +20 mV to +50 mV (P < 0.05, two-way ANOVA followed by Tukey’s multiple-comparisons test). G: dependence of tail current amplitude on [SCN−]ex. Currents are normalized by membrane capacitance, and voltages represent the membrane potential before the initiation of tail currents by returning to the holding potential. Symbols represent means and bidirectional error bars represent SE (n = 5–7 cells from 3 C57BL/6J mice). The mean tail current at each SCN− concentration is significantly larger compared with control (P < 0.05) for pre-pulses to voltages in the ranges of −120 mV to −30 mV and +20 mV to +50 mV. H: dependence of conductance on [SCN−]ex. Slope conductance was calculated from instantaneous currents in cells individually at each concentration. Symbols represent means and error bars represent SE (n = 5–7 cells from 3 C57BL/6J mice). The mean conductance at each concentration is significantly different for all comparisons (P < 0.01, one-way ANOVA followed by Tukey’s multiple comparisons test), except for 50 µM vs. 100 µM.

