Fig. 2.
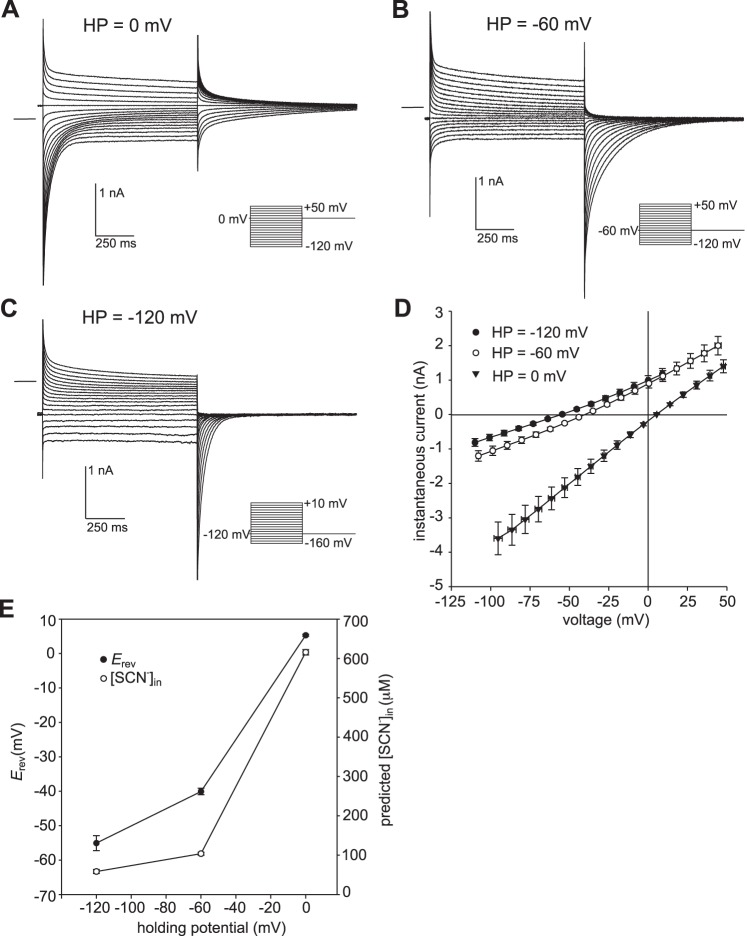
The effect of holding potential on currents produced in the presence of 500 µM external thiocyanate (SCN−). A–C: families of whole cell currents evoked in the same retinal pigment epithelial (RPE) cell from a holding potential of 0 mV (A), −60 mV (B), or −120 mV (C). The zero-current level is shown by the horizontal line to the left of each family of currents. The interval between the start of voltage steps was 7 s for holding potential (HP) = −120 mV and 3 s for HP = −60 mV and HP = 0 mV. The pipette and bath solutions contained 140 mM Cl− and 145.6 mM Cl−, respectively. D: summary of similar experiments (repeated measures in 7 cells from 2 C57BL/6J mice) showing current-voltage (I-V) plots of instantaneous current obtained from holding potentials of −120 mV (●), −60 mV (○), and 0 mV (▼). Symbols represent means and bidirectional error bars represent SE. Voltages are corrected for liquid junction potentials and the voltage drop across series resistance (Rs). Membrane potential (Vm) corrected for voltage errors averaged −110.0 ± 0.8 mV, −53.1 ± 0.2 mV, and +5.4 ± 0.1 mV at holding potentials of −120 mV, −60 mV, and 0 mV, respectively. The mean current amplitudes for the three holding potentials are significantly different from each other at all voltages, except for HP = −120 mV vs. HP = −60 mV at +10 mV (P < 0.05, two-way ANOVA followed by Tukey’s multiple-comparison test). E: dependence of reversal potential (Erev, ●, left y-axis) and intracellular SCN− concentration predicted for passive distribution (○, right y-axis) on holding potential. Symbols represent means and error bars represent SE (n = 7; P < 0.005, two-way ANOVA followed by Tukey’s multiple-comparison test).

