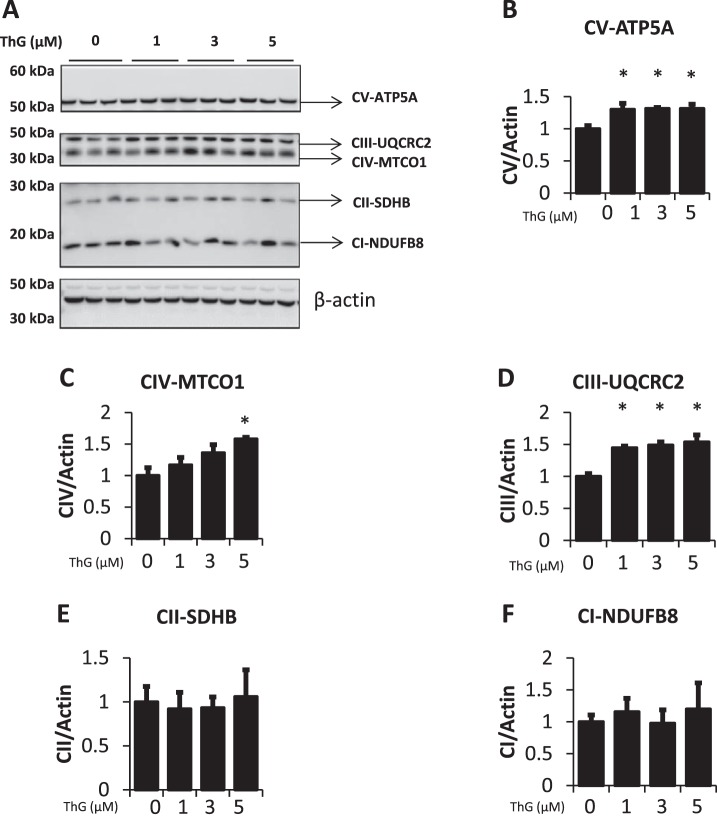
Fig. 6.
Effect of increasing doses of Thiamet-G (ThG) on mitochondrial complex proteins. A: The levels of complex I-V subunits in response to increasing doses of ThG (1, 3, and 5 µM) treatment for 6 h were measured. B–F: quantification of the Western blot images normalized to the untreated control. Data are means ± SE; n = 3 replicates per sample. *P < 0.05, different from untreated control.

