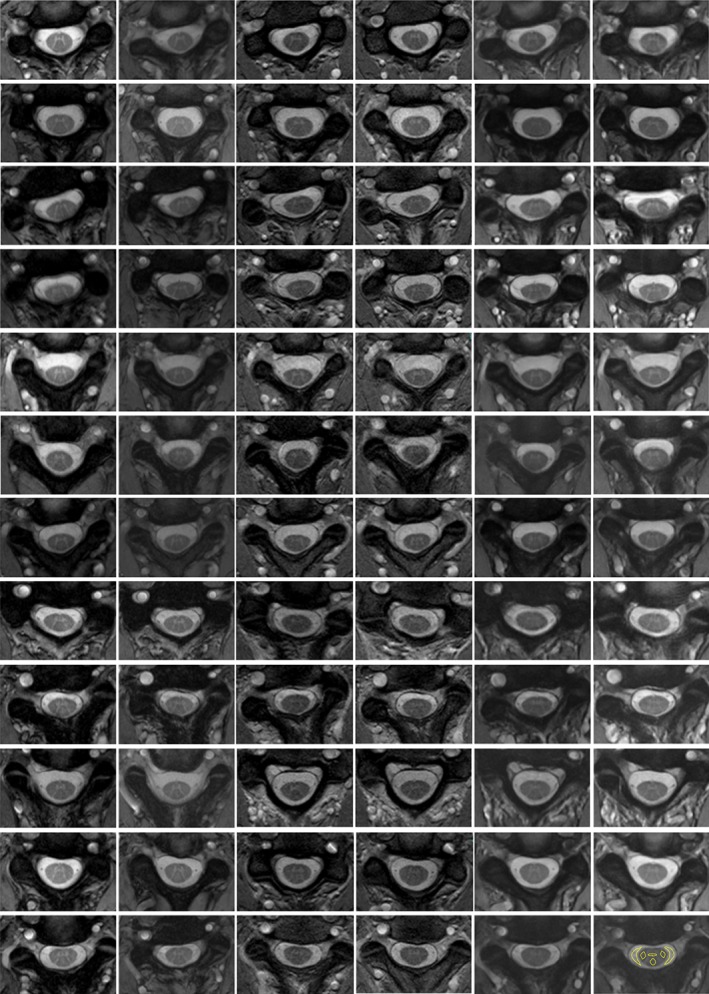
Figure 2.

T2*‐w images acquired at the C2‐C3 disc level for the 12 subjects on the three different scanners. Each row is a subject and from left to right: Siemens scanner test acquisition, Siemens scanner retest acquisition, Philips scanner test acquisition, Philips scanner retest acquisition, GE scanner test acquisition, and GE scanner retest acquisition. In the bottom right image an example of ROIs used for the CNR evaluation is reported.
