Figure 4.

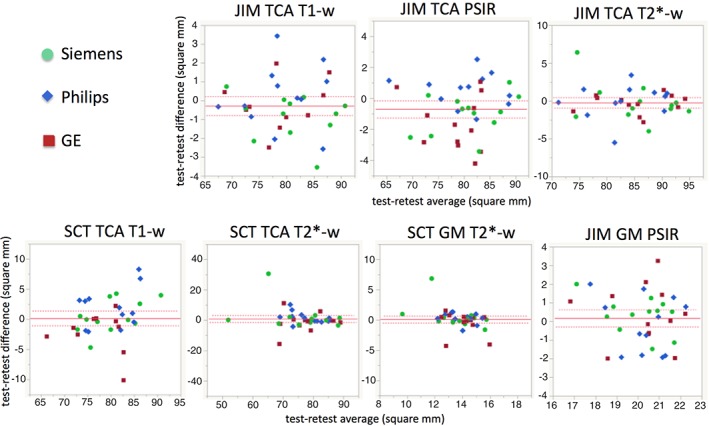
Bland–Altman plots reporting the difference between the TCA and GM area retest and test measurements (y‐axis) and their mean value (x‐axis), for all the combinations of software and protocol.

Bland–Altman plots reporting the difference between the TCA and GM area retest and test measurements (y‐axis) and their mean value (x‐axis), for all the combinations of software and protocol.