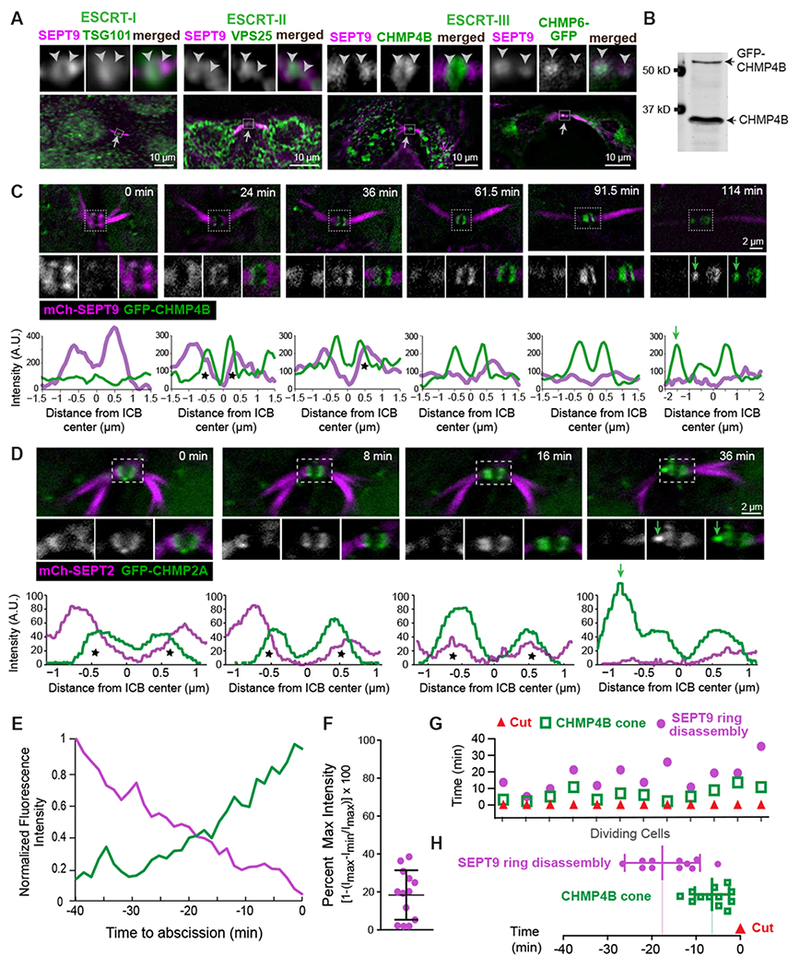
Figure 2. Assembly of the ESCRT machinery of abscission is spatiotemporally coupled to the septin double ring.

(A) SEPT9 localization with respect to endogenous TSG101, VPS25, CHMP4B and GFP-CHMP6 in the outlined ICB areas (arrows) of MDCK cells. Arrowheads are fixed in position and point to SEPT9-ESCRT overlap.
(B-D) Western blot (B) of MDCK-GFP-CHMP4B cell lysate and time-lapse images of GFP-CHMP4B with SEPT9-mCherry (C) and mCherry-SEPT2 with GFP-CHMP2A (D). Plots show the mean pixel intensity of septins (magenta) and GFP-CHMP2A/CHMP4B (green) across the width of the midbody. Asterisks highlight fluorescence overlap and green arrows point to the formation of ESCRT-III cones.
(E) Mean fluorescence intensity of GFP-CHMP4B and SEPT9-mCherry rings after normalization to a scale of 0 (min) to 1 (max) prior to abscission (t=0; n = 3 cells).
(F-H) Quantification of the fluorescence intensity of SEPT9-mCherry (percent of maximum) in the frame preceding the emergence a GFP-CHMP4B cone (F), and timing of SEPT9-mCherry ring disassembly and GFP-CHMP4B cone formation with respect to the ICB cut (t = 0) in individual cells (G) and as an average ± SD (H; n = 12 cells). See also Figure S2 and Videos S3 and S4.
