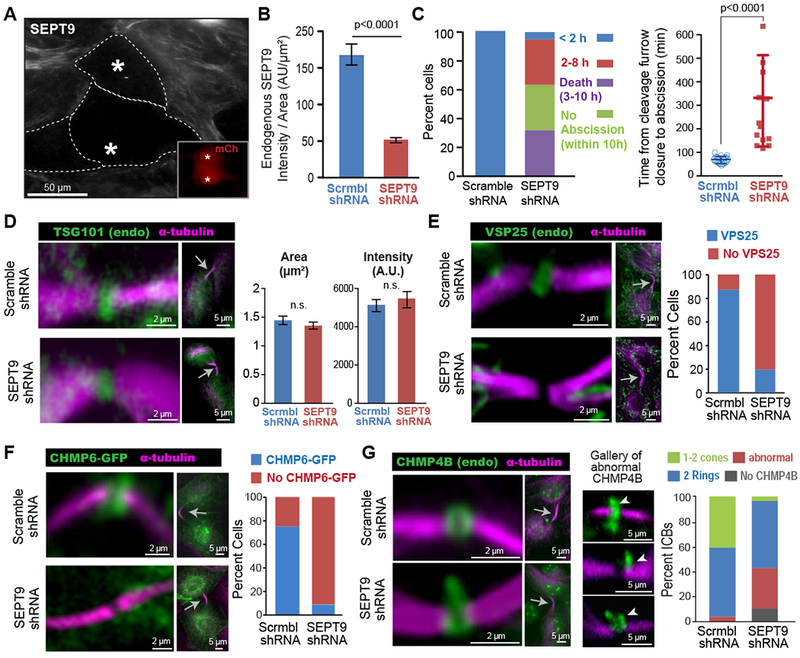
Figure 3. Septin 9 depletion abrogates the recruitment of VPS25 and CHMP6, and impairs proper ESCRT-III assembly.

(A-B) Image (A) of SEPT9 in MDCK cells transfected with shRNAs/mCherry (insets; asterisks). Quantification (B) of mean SEPT9 fluorescence intensity per area (± SEM) in cells treated with shRNAs (n = 30-33).
(C) Percentage of total cells that completed abscission under 2 h or within 2-8 h after cleavage furrow closure, and percent of cells that failed to undergo abscission or died within 10 h (n = 19). Plot shows the mean duration (± SD) of completed abscissions in control (n = 19) and SEPT9-depleted cells (n = 13).
(D) TSG101 and α-tubulin in the ICBs (arrows) of shRNA-treated MDCKs. Quantification of the mean area and fluorescence intensity (± SEM) of TSG101 in the center of the ICB (n = 32-34).
(E-F) Images show the localization of a-tubulin, VPS25 (E) and CHMP6-GFP (F) in the ICBs of MDCKs treated with shRNAs. Graph shows the percentage of ICBs with or with no VPS25 (n = 50) and CHMP6-GFP (n = 25-26).
(G) Localization of α-tubulin and CHMP4B in ICBs (arrow) of cells transfected with shRNAs. A gallery of defective CHMP4B phenotypes is shown and arrowheads point to distended accumulations of CHMP4B. Quantification shows percent ICBs without CHMP4B (absent) and with abnormally localized CHMP4B or two rings and 1-2 cones of CHMP4B in control (n = 64) or SEPT9-depleted (n = 86) cells. See also Figure S3.
