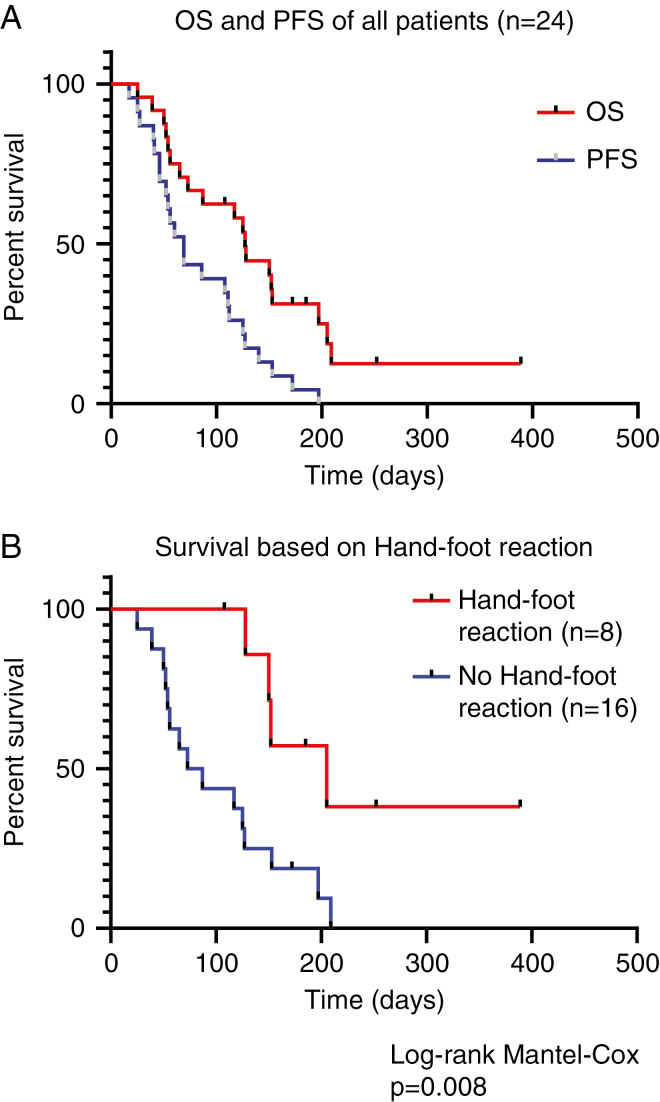
Fig. 1.
Clinical outcome in a retrospective bicentric cohort of 24 patients with advanced high-grade gliomas. (A) Kaplan–Meier plot showing overall survival (OS, red curve) and progression-free survival (PFS, blue curve) of all 24 patients. (B) Kaplan–Meier plot showing overall survival of patients with hand-foot reaction (HFR; red) compared with patients who did not experience HFR (blue).

