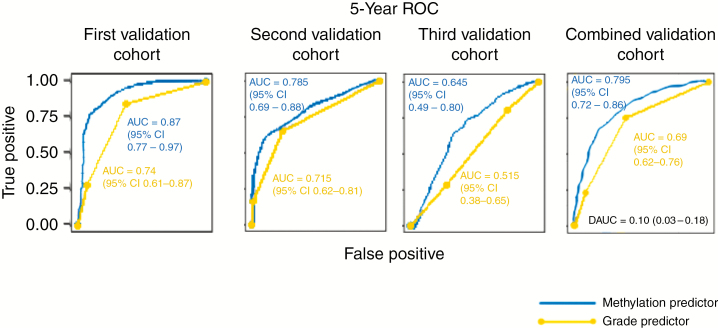
Fig. 1.
Comparison of grade-based and methylome-based RFS predictor performance. Data presented are time-dependent ROC curves and average AUC as well as ΔAUC (DAUC) with 95% CI using 10 000 bootstrap resampling validation approach for methylome-based and grade-based predictors in the (A) first validation cohort, (B) second validation cohort, (C) third validation cohort, and (D) combined validation cohorts.

