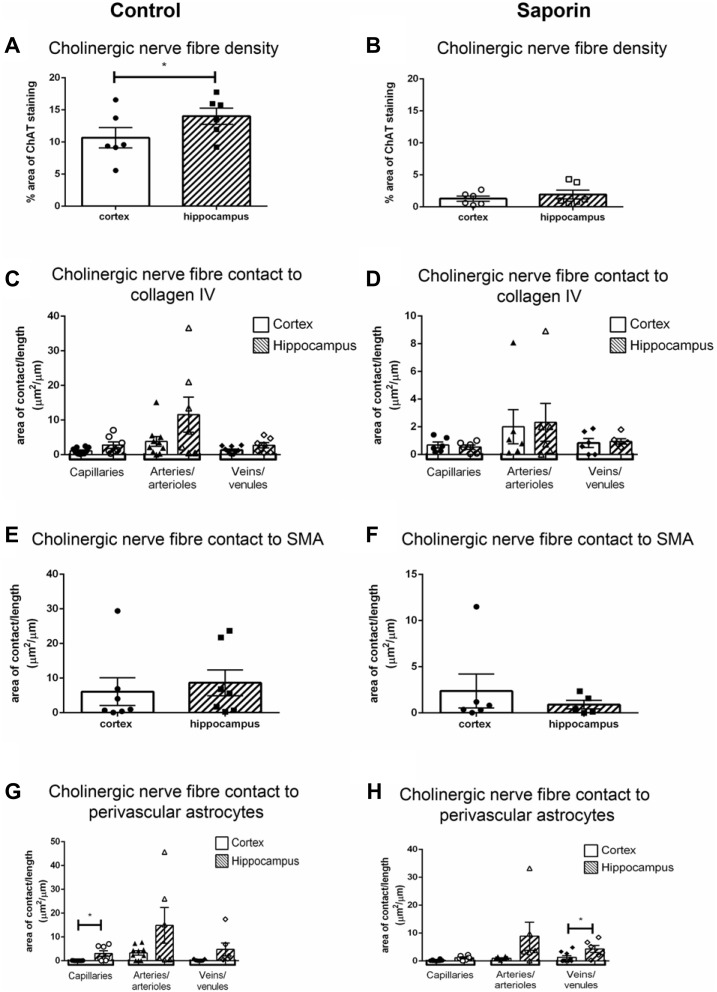
Figure 7.
Regional comparison of measures of the NVU. (A,B) Total density of ChAT-positive fibers in the cortex and hippocampus in control mice (A) and following administration of saporin (B). (C–H) Quantification of area of contact between ChAT-positive fibers and collagen IV (C,D), SMA (E,F) and astrocyte endfeet (G,H) in the cortex and hippocampus in control (C,E,G) and saporin-treated mice (D,F,H). Data represent mean ± SEM. *p < 0.05, paired two-tailed Student’s t-test (A,B), Kruskal-Wallis with Dunn’s post hoc test, (C,D), Wilcoxon matched paired test (E–H).

