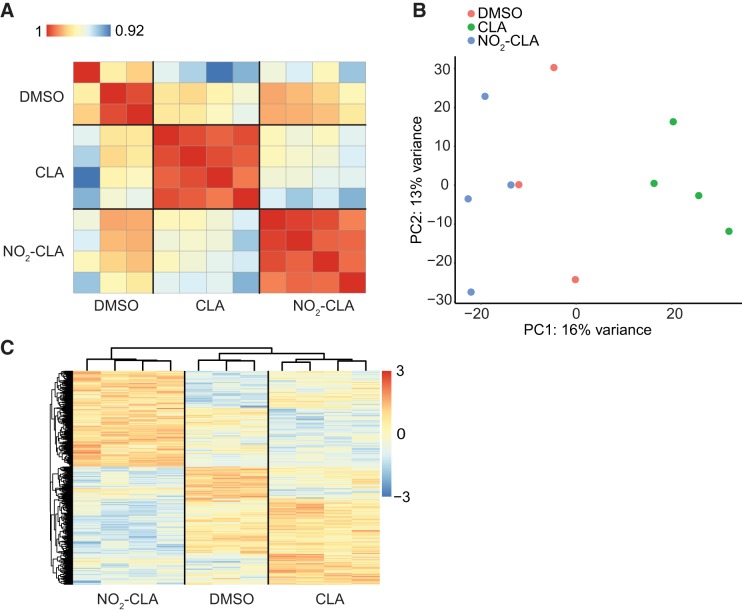
Fig. 2.
Differentially expressed genes (DEGs) in HCAECs. A: correlation matrix (Pearson correlation coefficients) of all samples. B: principal component analysis of the DEGs. C: heat map and hierarchical clustering of the DEGs between different treatments. Color bar [red to blue (3 to −3) vertical bar] denotes the row-scaled transcripts per kilobase million (TPM) value, representing the Z score of gene expression across samples.

