
Fig. 6.
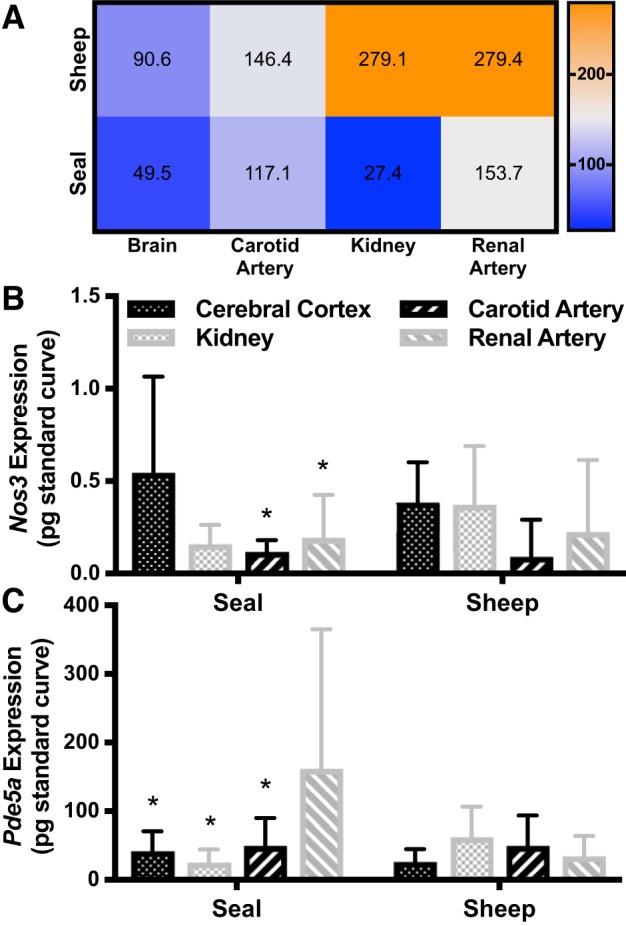
A: heat map of median nitric oxide (NO) responsiveness to compare species-specific differences among tissues. NO responsiveness is highest in sheep kidney and renal artery and lowest in seal kidney, possibly limiting vasodilation potential. NO responsiveness is calculated as NO-stimulated guanylyl cyclase (GC) activity normalized to baseline GC activity in the same sample; therefore, only samples that could be resolved within the standard curve in both assay conditions are included (sheep: brain n = 6, carotid n = 8, kidney n = 4, renal n = 8; seal: brain n = 7, carotid n = 9, kidney n = 7, renal n = 11). B: Nos3 (NO synthase-3) expression was higher in seal brain (cerebral cortex) than in kidney and renal artery. C: phosphodiesterase-5a (Pde5a) expression was higher in seal renal artery than in other seal tissues. There were no differences between sheep tissues in expression of either mRNA. Error bars represent means ± SD. Asterisks (*P < 0.05) denote significant Sidak post hoc differences between seal tissues from cerebral cortex (Nos3 comparison) and from renal artery (Pde5 comparison).