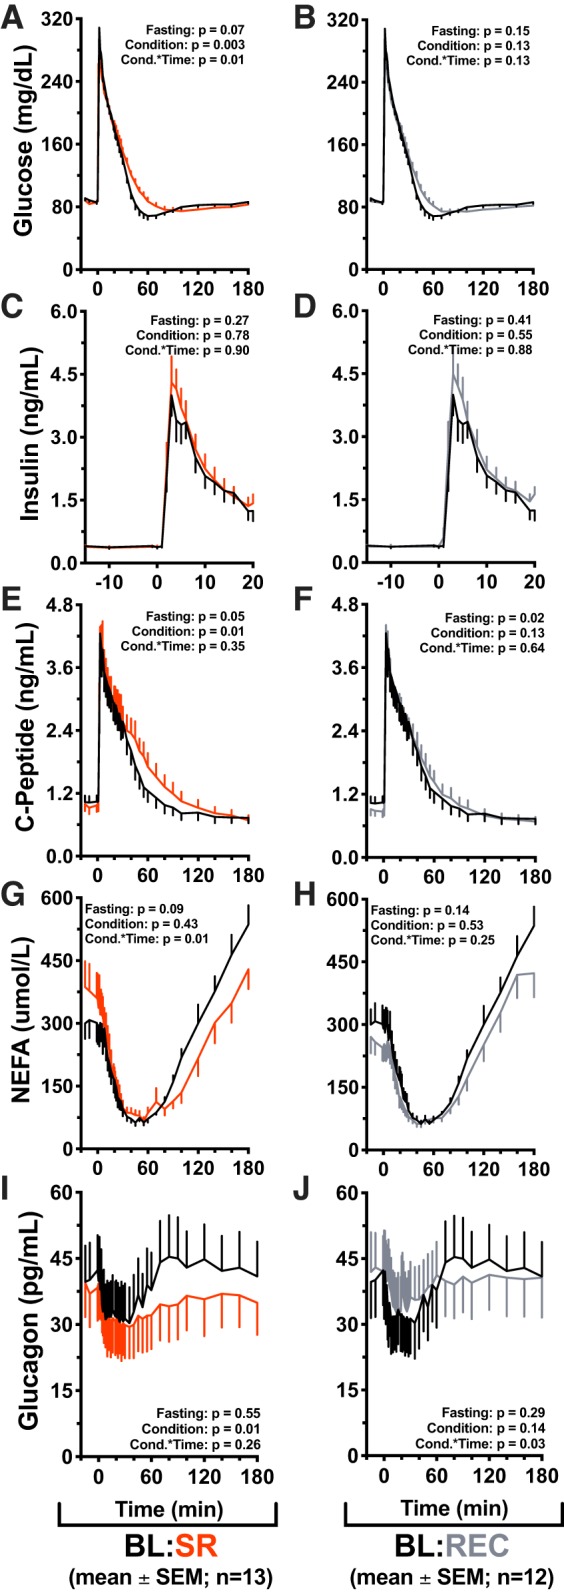
Fig. 4.

Effects of sleep restriction on intravenous glucose tolerance test (IVGTT) responses. Values are plotted as means ± SE; n, number of participants. Effects of sleep restriction on intravenous glucose tolerance test (IVGTT) responses. Mean values are ± SE, P values are reported on each graph: Fasting = differences during min −15 to 0, Condition = significance of the condition effect, Cond.*Time = significance of the condition × time interaction. Graphs are oriented relative to glucose infusion time (infusion = minute 0). Black lines: baseline (BL; n = 13) (10 h/night time in bed (TIB) for 3 nights); red lines: sleep restriction (SR; n = 13) (5 h/night TIB for 5 nights); gray lines: recovery (REC; n = 12) (10 h/night TIB for 2 nights). A: baseline vs. sleep restriction glucose values during the IVGTT procedure. Significant effect of condition (P = 0.003) and condition × time interaction (P = 0.01). B: baseline vs. recovery IVGTT glucose. C and D: acute phase insulin values (minute 0 through minute 20). E: IVGTT c-peptide values in baseline vs. sleep restriction conditions. Significant effect of condition (P = 0.01), marginally significant difference in fasting values (P = 0.05). F: baseline vs. recovery IVGTT c-peptide. Significant difference in fasting values (P = 0.02). G: baseline vs. sleep restriction IVGTT nonesterified fatty acid (NEFA) values. Significant condition × time interaction (P = 0.01). Post hoc test for differences by condition during NEFA rebound (minutes 70 through 180) found that NEFA rebound was significantly suppressed in the sleep restriction condition (P = 0.01). H: baseline vs. recovery IVGTT NEFA values. I: IVGTT glucagon values in baseline vs. sleep restriction. Significant effect of condition (P = 0.01). J: IVGTT glucagon values in baseline vs. recovery sleep conditions. Significant condition × time interaction (P = 0.03).
