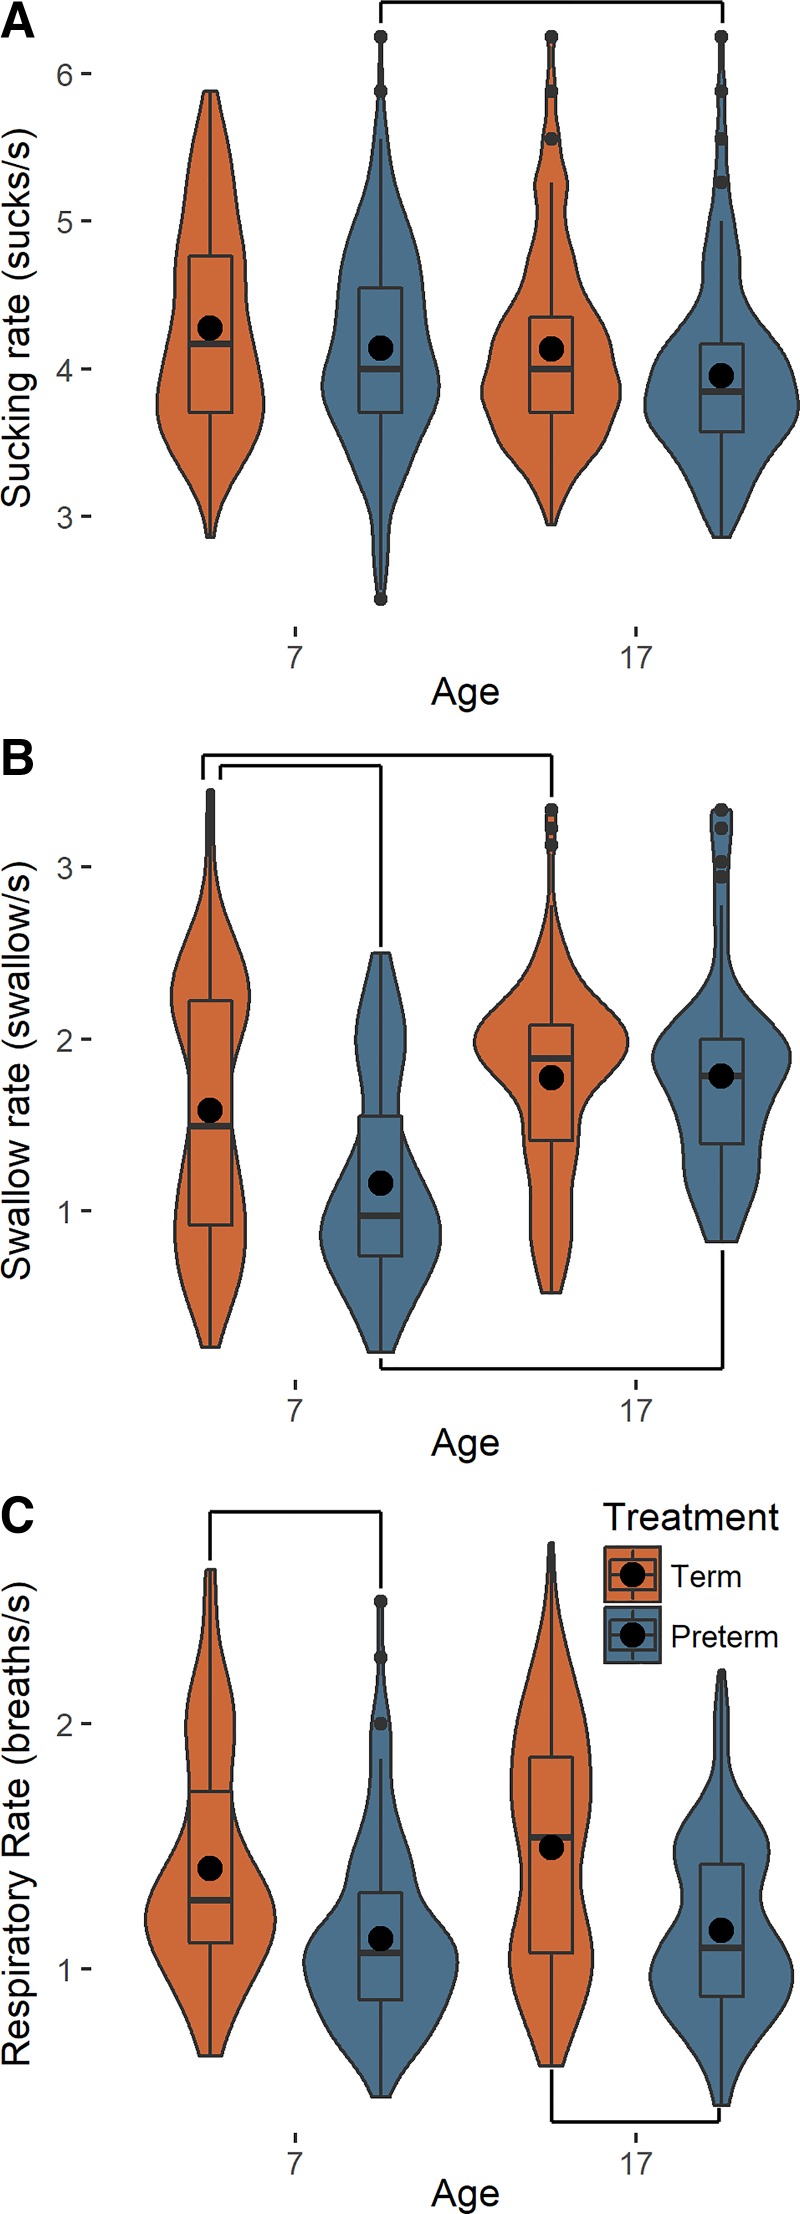
Fig. 1.
Maturation of sucking and swallowing relationships in term (orange) and preterm (blue) pigs through ontogeny. A; sucking rate during feeding (day 7: term n = 386 sucks, preterm n = 420 sucks; day 17: term n = 450 sucks, preterm n = 374 sucks). B: swallow rate (day 7: term n = 158 swallows, preterm n = 96 swallows; day 17: term n = 196 swallows, preterm n = 136 swallows). C: respiratory rate during feeding (day 7: term n = 159 breaths, preterm n = 122 breaths; day 17: term n = 178 breaths, preterm n = 158 breaths) on days 7 and 17. Small black dots are outliers; large black circles are means; box and whisker plots show median and interquartile range; width of each plot indicates the frequency distribution of the data along the y-axis; and lines connecting plots show significant differences identified by mixed models or Tukey’s post hoc analyses when interactions were significant (P < 0.05).

