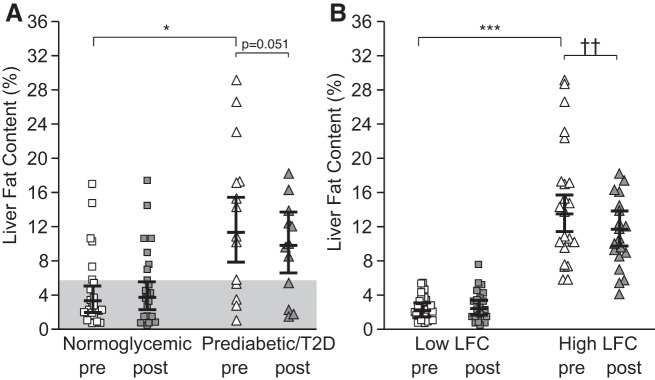
Fig. 3.
Liver fat content (LFC) before and after 2 wk of intervention. A: effects of 2 wk of sprint interval training (SIT) and moderate-intensity continuous training (MICT) on LFC in normoglycemic men and men with prediabetes/type 2 diabetes (T2D; men only, n = 44). B: effects of SIT and MICT on LFC in high-LFC and low-LFC groups (men and women; n = 54). The shaded area in A denotes normal liver fat content (≤5.6%). Post, posttraining; Pre, pretraining. All values are expressed as model-based means, and bars are 95% confidence intervals. *P ≤ 0.05 baseline differences between the normoglycemic men and men with prediabetes/T2D. ***P ≤ 0.001 baseline differences between low-LFC and high-LFC groups. ††P ≤ 0.01 time effect for the high-LFC group.

