Fig. 1.

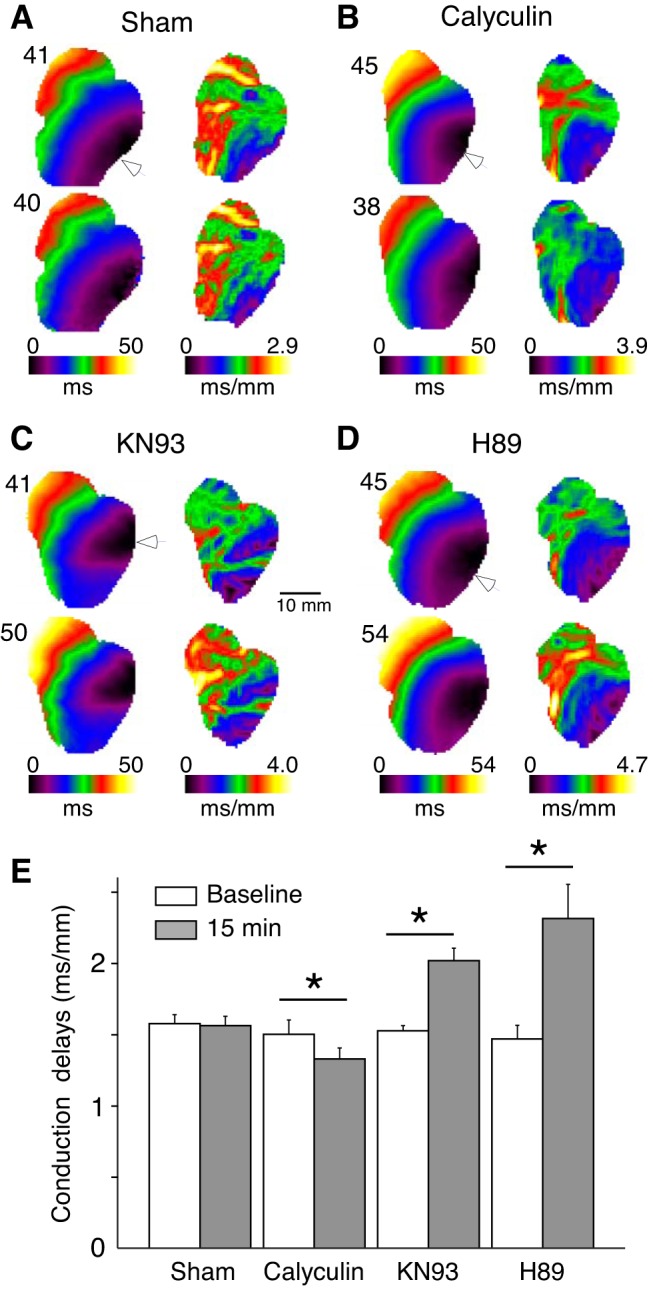
Regulation of ventricular conduction by kinases and phosphatases. A–D: representative activation maps (left) and the corresponding conduction delay maps (right) at baseline (top) and after 15 min drug/vehicle perfusion (bottom) in hearts treated with vehicle (DMSO; A), phosphatase inhibitor calyculin (B), CaMKII inhibitor KN93 (C), and PKA inhibitor H89 (D) experiments. Numbers above the activation maps indicate the latest activation time (ms) for each experimental condition. E: group wise means ± SE values of the local conduction delays averaged over the entire mapped surface at baseline and after 15 min of drug/vehicle perfusion. All data were obtained during left ventricle pacing at the locations indicated by white arrowheads, at cycle length (CL) = 300 ms. *P < 0.05 vs. baseline, paired Student’s t-test; sham: n = 4; calyculin: n = 6; KN93: n = 6; and H89: n = 5.
