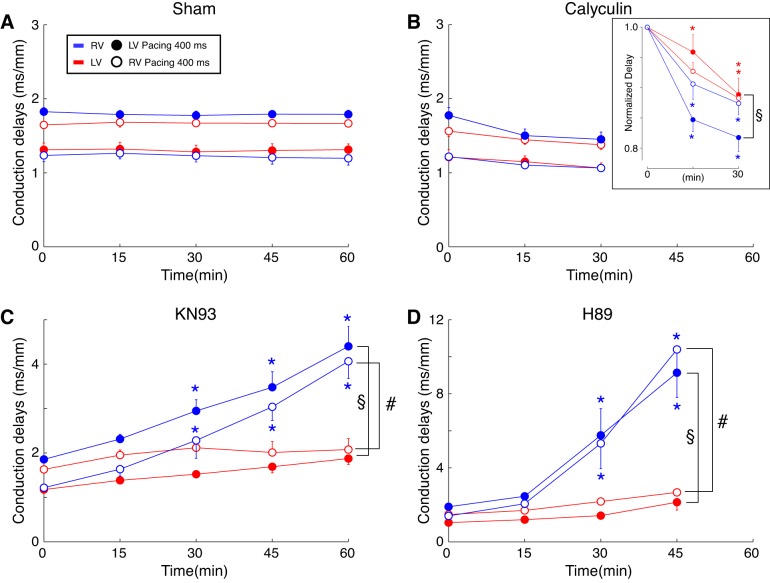
Fig. 6.
Statistical analysis addressing the effect of chamber, time, and pacing location on the drug-induced conduction delay changes for each experimental group. A–D: group-wise means ± SE of the right ventricle (RV) (blue) and the left ventricle (LV) (red) conduction delay values in sham (A), calyculin (B), KN93 (C), and H89 (D) groups. For each heart, the RV and the LV conduction delay values were computed by averaging over all pixels in the respective regions of the local conduction delay maps. All data shown obtained at pacing cycle lengths (CLs) of 400 ms. Open and closed symbols represent conduction delays during pacing at the RV and the LV pacing site, respectively. A two-way ANOVA was designed to assess the role of chamber, drug perfusion time, and the chamber-time interaction in the distribution of mean RV and LV conduction delay values. The analysis was performed separately for each experimental group and each pacing location. For calyculin group, additional two-way ANOVA was applied to data normalized to the baseline values (B, inset). §P < 0.05 for chamber-time interaction during LV pacing; #P < 0.05 for chamber-time interaction during RV pacing. *P < 0.05 vs. 0 min (predrug) at the same chamber and pacing location. Multiple comparisons were corrected using the Tukey-Kramer post hoc test.

