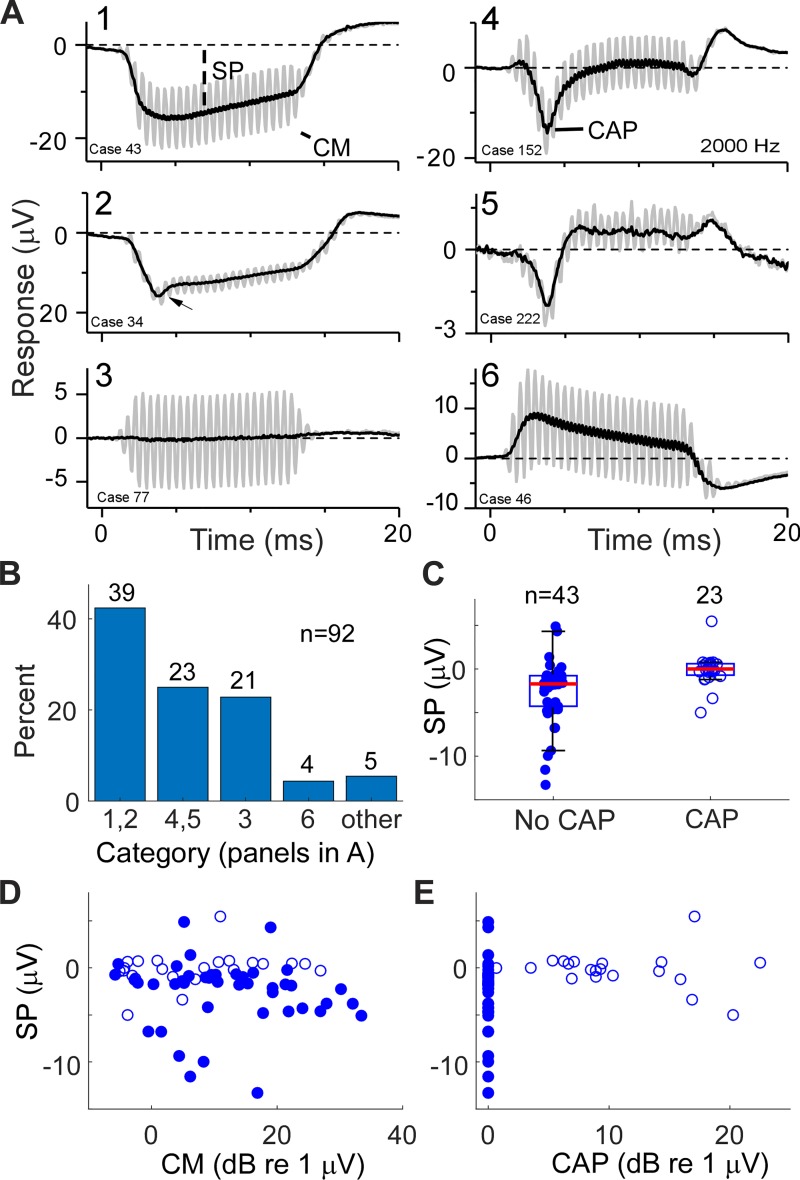
Fig. 13.
Patterns of responses in human cochlear implant (CI) subjects, including the cochlear monophonic (CM), compound action potential (CAP), and summating potential (SP). A: examples of responses from human CI subjects. A1–A6 are each from a different subject and show the responses to condensation-phase stimuli (gray) to highlight the CM and the average of alternated phases (black) to highlight the CAP and SP. A1: a case with no CAP and a strongly negative SP. Subject age: 43 yr; etiology of hearing loss: auditory neuropathy spectrum disorder (ANSD). A2: an interesting case with a negative peak that could be neural (a CAP) or from a mixture of outer hair cells and inner hair cells (see the post-kainic acid response from the normal hearing animal in Fig. 8A for comparison). Subject age: 65 yr; etiology: Meniere’s disease. A3: a case with a large CM but no CAP or SP. Subject age: 2 yr; etiology: ANSD with cochlear nerve deficiency from imaging. A4: a case with a large CAP and small SP. Subject age: 66 yr; etiology: Meniere’s. A5: a case with a large CAP and positive SP. Subject age: 73 yr; etiology: sensorineural hearing loss. A6: a case with no CAP and a positive SP. Subject age: 2 yr; etiology: ANSD with cochlear nerve deficiency from imaging. B: distributions of the different response types illustrated by A1–A6. C: box and scatter plots of SP for cases with and without a CAP. Cases without a CAP had a wider range, particularly with negative polarities, than cases with a CAP. Red line indicates median, box indicates the semi-interquartile range, and whiskers indicate the range not considered outliers. D: CM vs. SP, showing that cases without a CAP (closed circles) could have a large, negative SP even though the CM was small. Open circles represent cases with a CAP. E: CAP vs. SP, providing another view of these relationships.

