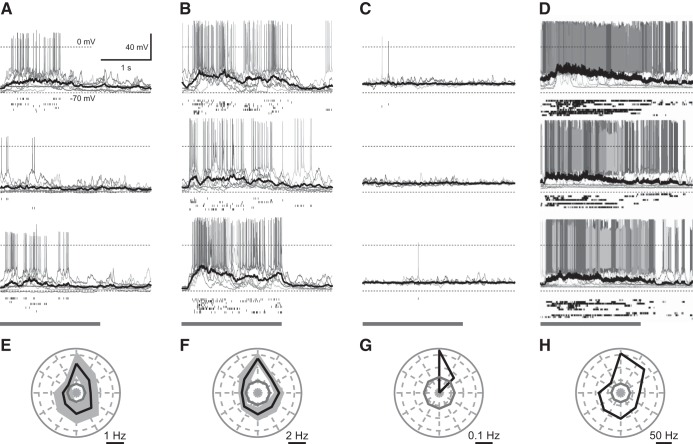
Fig. 8.
Visually evoked response (A–D) from preferred (top), orthogonal (middle), and anti-preferred (bottom) grating orientations, and spike orientation tuning (E–H) of layer 5 cell types with the preferred direction aligned to point up. A and E are nonbursting, B and F are bursting, C and G are putative SOM+, D and H are putative PV+. A–D: gray bar indicates duration of visual stimulation presentation. Solid black line represents the average subthreshold response. Scaling of plots is the same unless otherwise specified. E–H: solid black lines indicate the mean spike tuning response and the limits of the black-shaded region represent means ± SE. For G and H: only 1 cell was recorded so no ± SE is shown. E–H: gray solid line indicates the spontaneous background firing rate.

