Fig. 6.
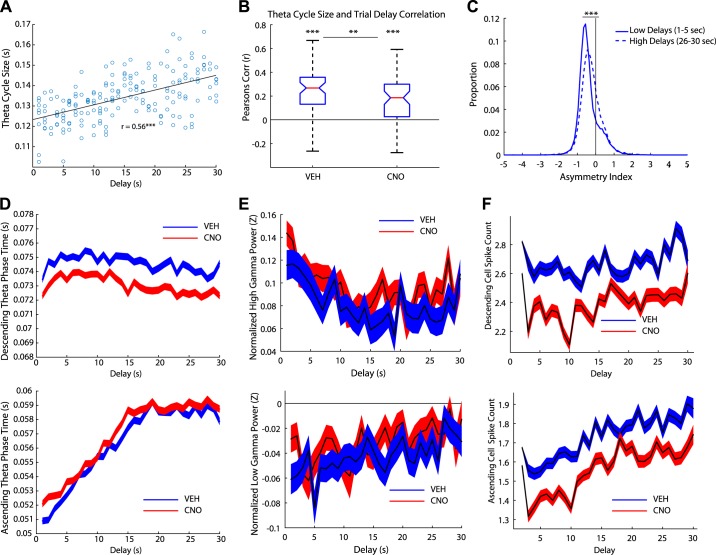
Theta oscillations correlated with trial delays. A: an example day of the relationship between theta cycle size and trial delays for one rat on 1 day. B: theta cycle size was positively correlated with trial delay for both vehicle (Veh) and clozapine N-oxide (CNO) days. However, the relationship for CNO days was significantly lower than Veh days. C: distribution of the asymmetry index (AI) for low delays (1–5 s) and high delays (26–30 s) on Veh days. High delays were more symmetric than low delays, suggesting that high delays exhibited more nonlocal activity. D: we measured the duration of the descending theta phase across delays (top). The descending duration decreased across delays (mean ± SE) and was reduced on CNO days. In contrast, the ascending duration increased with delay, suggesting there was more nonlocal activity during longer trial delays (bottom, mean ± SE). The duration of the ascending theta phase increased on CNO days. E: we measured the normalized high gamma power across trial delays (top). High gamma power slightly decreased across delay. In contrast, the normalized low gamma power increased across trial delays (bottom). F: the spike count for all cells was measured across the trial delays during the descending phase (top) and ascending phase (bottom). Spike counts linearly increased on the ascending phase as the trial delay increased. **P < 0.01, ***P < 0.001.

