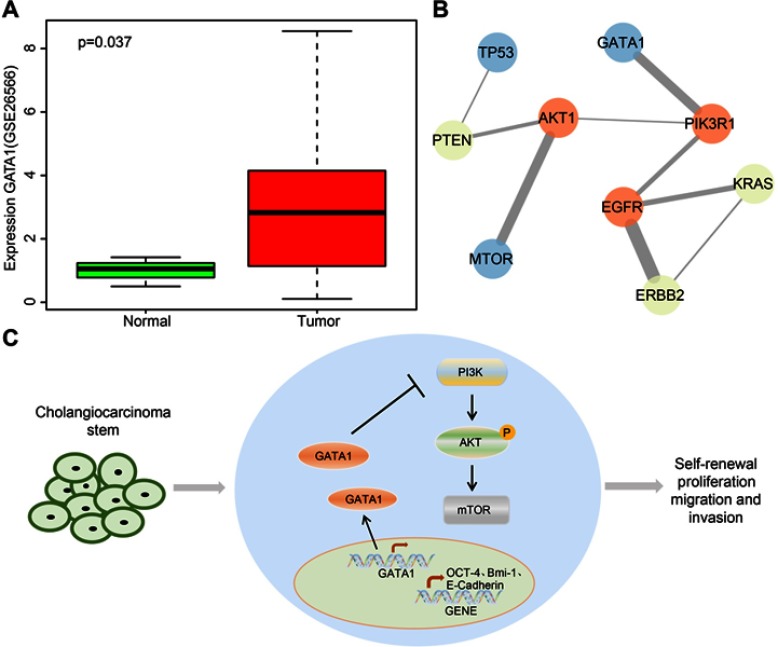
Figure 1.
GATA1 affects the onset of CCA via regulation of the PI3K/AKT pathway. (A) The green box diagram represents the sequencing expression of the gene in normal samples, the red box diagram indicates the sequencing expression of GATA1 in CCA samples and p is obtained by using the R language “Limma” package for differential expression calculation for GATA1; (B) the color of the round represents the core level of the protein, the deeper color reflects the core level and the thickness of the lines indicates the reliability of the interaction between the two proteins; thicker line reflects the reliability of the interaction; (C) mechanism map of GATA1 in CCA stem cells.

