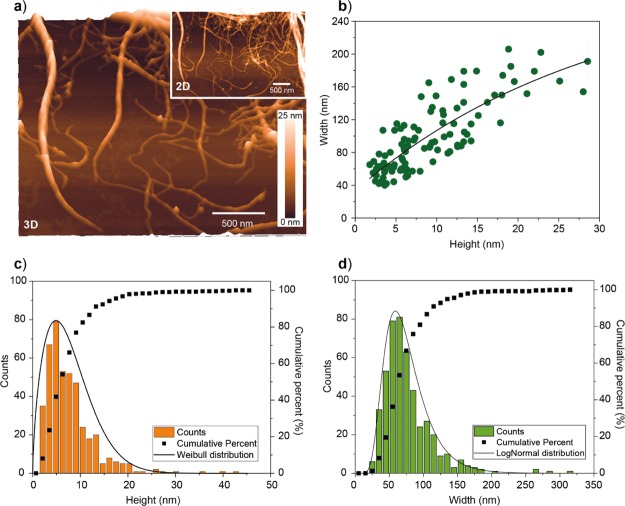
Figure 2.
(a) Representative AFM images obtained from dip casting a 0.01 mg mL–1 CNF suspension, followed by rapid blotting onto PEI-coated mica used as a solid support. (b) Correlation between the lateral and height dimensions of CNFs obtained from AFM. Distributions of (c) height and (d) width obtained from AFM imaging. The exponential decay fit shown in (b) is given by “width = −257.4 × exp(−height/(29.8)) + 290.7”.

