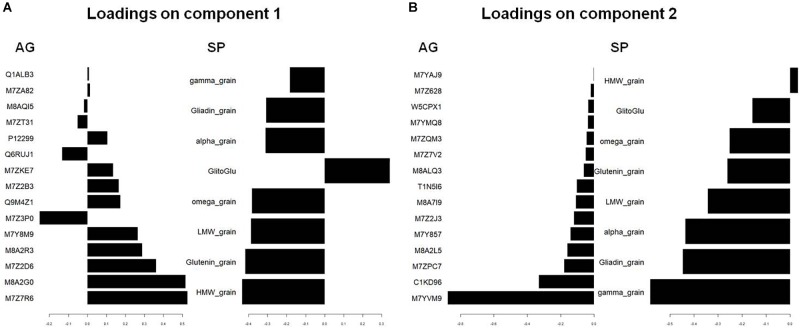
FIGURE 3.
Visualization by plotLoadings after a supervised classification by sPLS of the variables that are the best discriminating on component 1 (A) and component 2 (B). The figure shows coefficient weight of the features selected on component 1 and component 2, with the maximal variable weight (numerical scale) on each feature in the two datasets blocks: AG and SP. The Uniprot identification is used for AGs. HMW_, LMW_, glutenin_grain indicate the quantity per grain of LMW-, HMW-, and total glutenins. Alpha_, gamma_, omega_, and gliadine_grain indicate the quantity per grain of Alpha_, gamma_, omega_, and total-gliadins. GlitoGlu is the gliadin to glutenin ratio.

