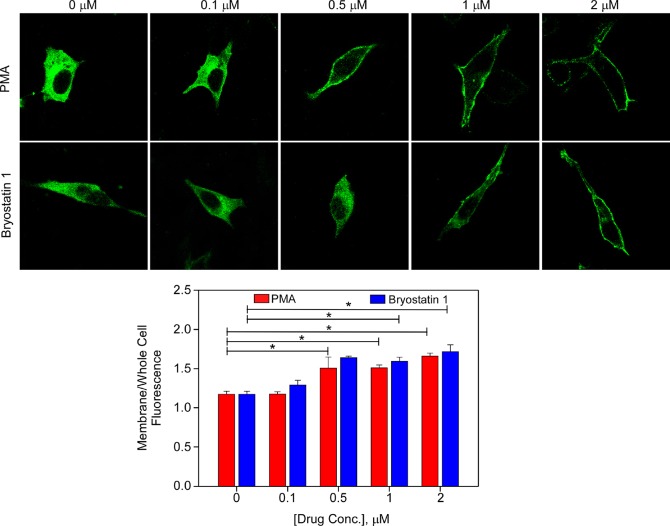
Figure 3.
Effect of PMA and bryostatin 1 on Munc13-1 membrane translocation. The top panel shows representative confocal images showing HT22 cells expressing Munc13-1, treated with PMA or bryostatin 1 (0–2 μM) for 5 min. The bottom panel shows a bar graph of values for the normalized membrane to whole cell fluorescence intensity ratio, quantified from confocal images from the multiple experiments, of which the top panel is representative. Data are expressed as means ± SEM of at least three independent experiments and obtained from four to nine confocal cell images per treatment. Two-way ANOVA, followed by Tukey’s post hoc test, was used for analysis of statistical significance. *P < 0.05 compared to the vehicle control. HT22 cells were transiently transfected with Munc13-1, and confocal image analysis was carried out as described in Materials and Methods.

