
FIGURE 3.
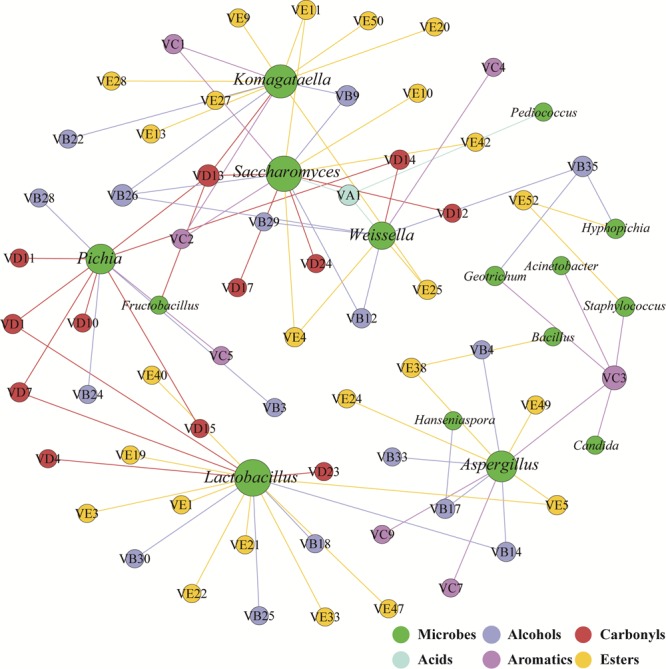
Correlation network between microbial genera (green) and flavors (other colored circles indicate different groups of compounds) was calculated by statistically significant (P < 0.05) and Pearson correlation coefficient (r > 0.6). The size of the circles is linked to the number of edge of microbial genera and flavors.