
FIGURE 7.
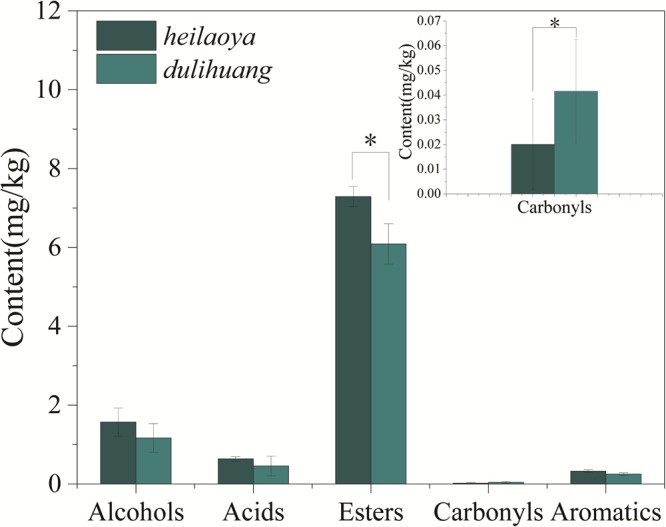
Content of different flavors at the end of fermentation. Significant differences P< 0.05 (Students t-test) is denoted by ∗.
Official websites use .gov
A
.gov website belongs to an official
government organization in the United States.
Secure .gov websites use HTTPS
A lock (
) or https:// means you've safely
connected to the .gov website. Share sensitive
information only on official, secure websites.
Content of different flavors at the end of fermentation. Significant differences P< 0.05 (Students t-test) is denoted by ∗.