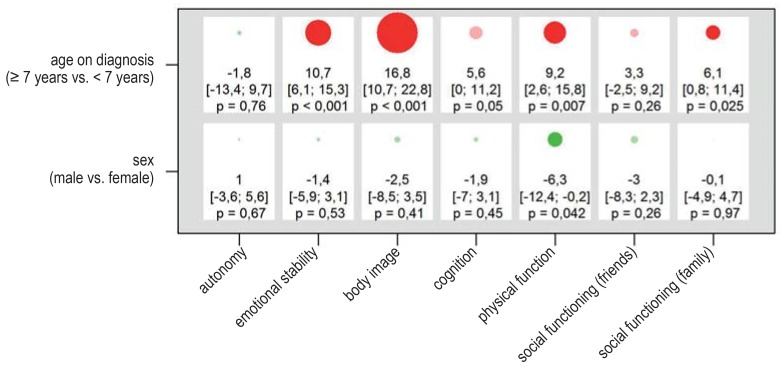
eFigure 4.
Results of the linear mixed model for self-assessed quality of life in the overall patient cohort (n = 131). The PEDQOL score was modeled separately in each domain as a function of time, the factor in question, and the interaction between time and the factor in question. The results are displayed as differences of least-square estimates, with the associated 95% confidence intervals and p-values, describing the mean difference in PEDQOL scores between the two categories of each factor. The size of the circles is proportional to the mean difference; circles representing positive and negative effects on the quality of life are colored green and red, respectively (opaque when p = 0.05). A box corresponds to the results of a model. The higher the PEDQOL score, the lower the subjective quality of life; a minus sign thus indicates a beneficial influence on the quality of life.
PEDQOL, Pediatric Quality of Life Questionnaire

