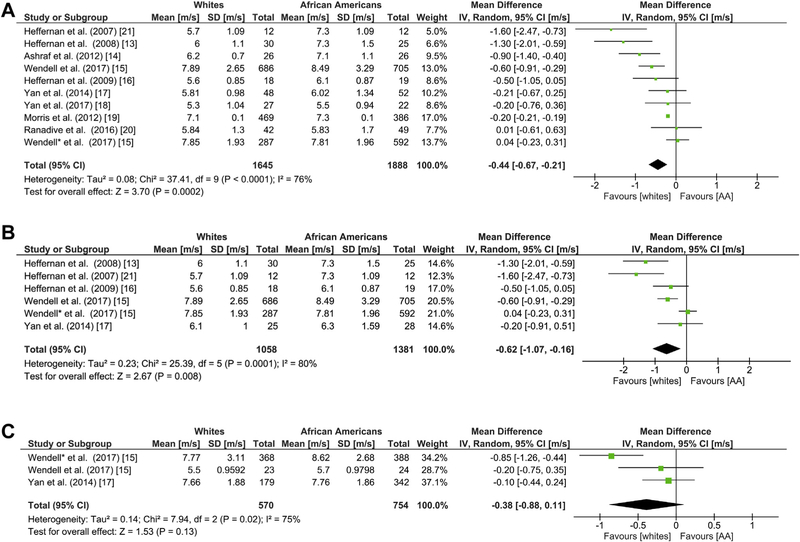
Fig. 2. Racial Differences in cfPWV.
Forest plots showing the mean differences in cfPWV pulse wave velocity as measured in meters/second (m/s) between African Americans and whites in (a) all sexes (b) male, and (c) female groups. The estimated mean difference for each group is presented as a square with the corresponding 95% confidence interval (CI). The pooled estimated mean difference is depicted as a diamond and derived from the random effects model.

