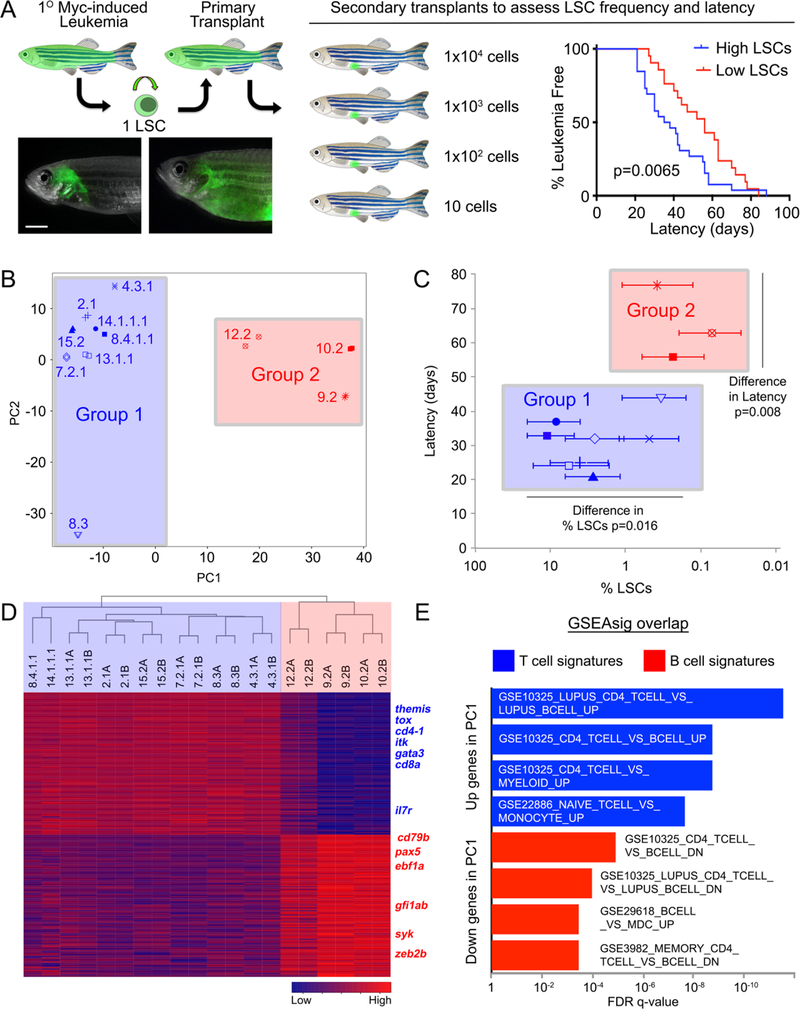
Figure 1. Myc-induced ALLs comprise two distinct molecular subtypes that differ in latency and leukemia stem cell number.
(A) A schematic of the cell transplantation screen previously used to identify differences in latency and leukemia stem cell number (LSCs) between ALL clones (Blackburn et al., Cancer Cell, 2014). ** denotes p=0.0065, by Wilcoxon rank order test. (B) RNA sequencing and principal component analysis of ALLs with high and low LSCs. All samples, except for 14.1.1.1 and 8.4.1.1, were assessed as technical replicates. Group 1 leukemias are demarcated by blue shading, while group 2 leukemias have been shaded in red in panels B, C, and D. (C) The two molecularly-defined subgroups differ in latency and LSC frequency when assessed by Wilcoxon Rank Sum Test. (D) Heat map and hierarchical clustering of group 1 and group 2 leukemias showing the top 100 genes positively and negatively correlated with PC1. (E) Gene set enrichment analysis using genes positively and negatively correlated with PC1. Genes positively correlated with PC1 are associated with T cells while those found to be negatively correlated with PC1 were B cell associated genes.

