
FIGURE 5.
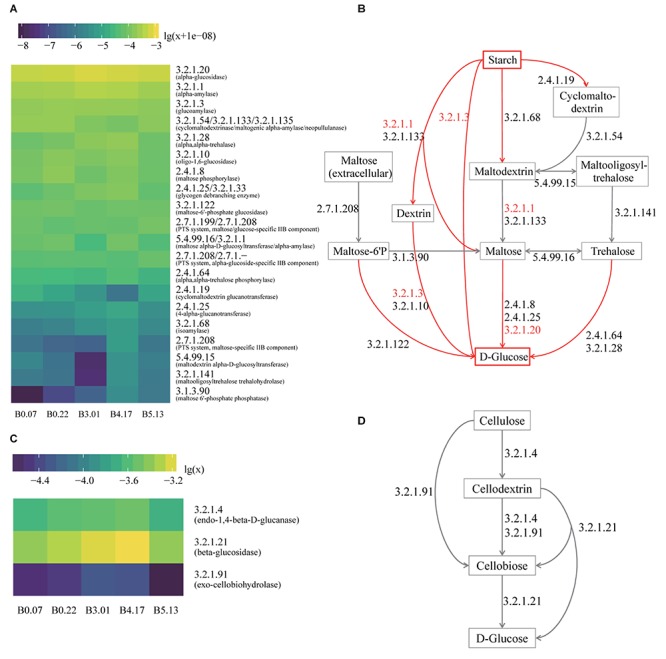
The functional analysis of five mature samples based on metagenome annotation. (A) The heatmap of all genes annotated to the enzymes in the hydrolysis of starch to glucose. The values are decimal abundances transformed with the formula log10(relative abundance+1e-08) (the sum of relative abundances of total genes including other enzymes equals to 1). The labels of Y axis are the EC numbers and enzyme names within parentheses. (B) The hydrolysis pathway of starch to glucose. The red arrows are the actual process of liquefaction and saccharification, which are the hydrolysis of the starch and the production of the glucose. The EC numbers in red refer to the top three enzymes with high gene abundance. (C) The heatmap of all genes annotated to the enzymes in cellulose hydrolysis. The values are decimal abundances transformed with the formula log10(relative abundance). (D) The hydrolysis pathway of cellulose to glucose, which is the process in CA detection.