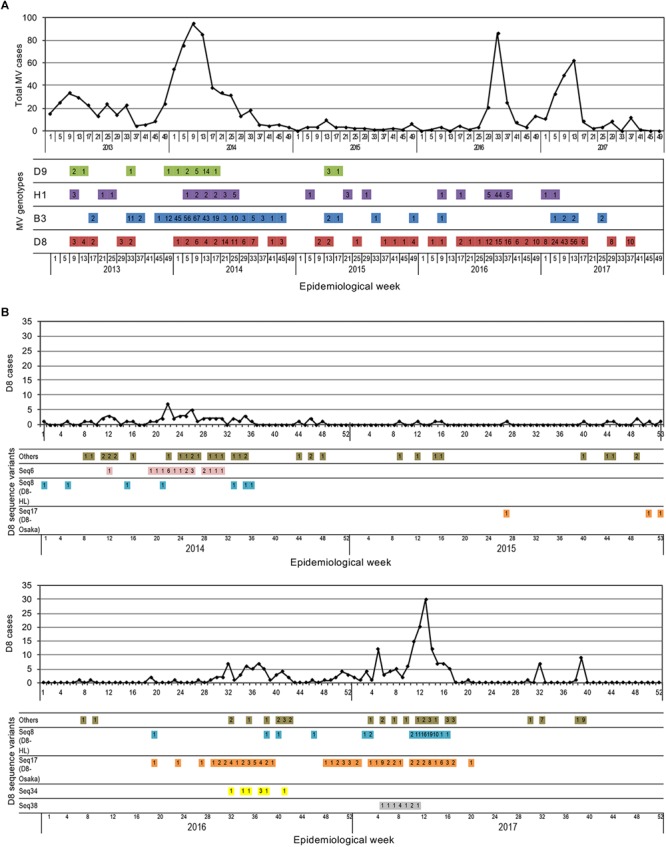
FIGURE 5.

Time course of detection of MV strains by week. (A) The time course detection of all genotype strains detected between 2013 and 2017. The line graphs show the total number of reported measles cases. The colored horizontal bars show the genotype data of MV strains. The number of reported measles cases for each genotype is shown in the colored horizontal bars. (B) The time course detection of genotype D8 strains detected between 2014 and 2017. The line graphs show the total number of reported genotype D8 MV cases. The colored horizontal bars show the data of individual sequence variant D8 MV strains. The number of reported measles cases for each sequence variant D8 MV strain is shown in the colored horizontal bars.
