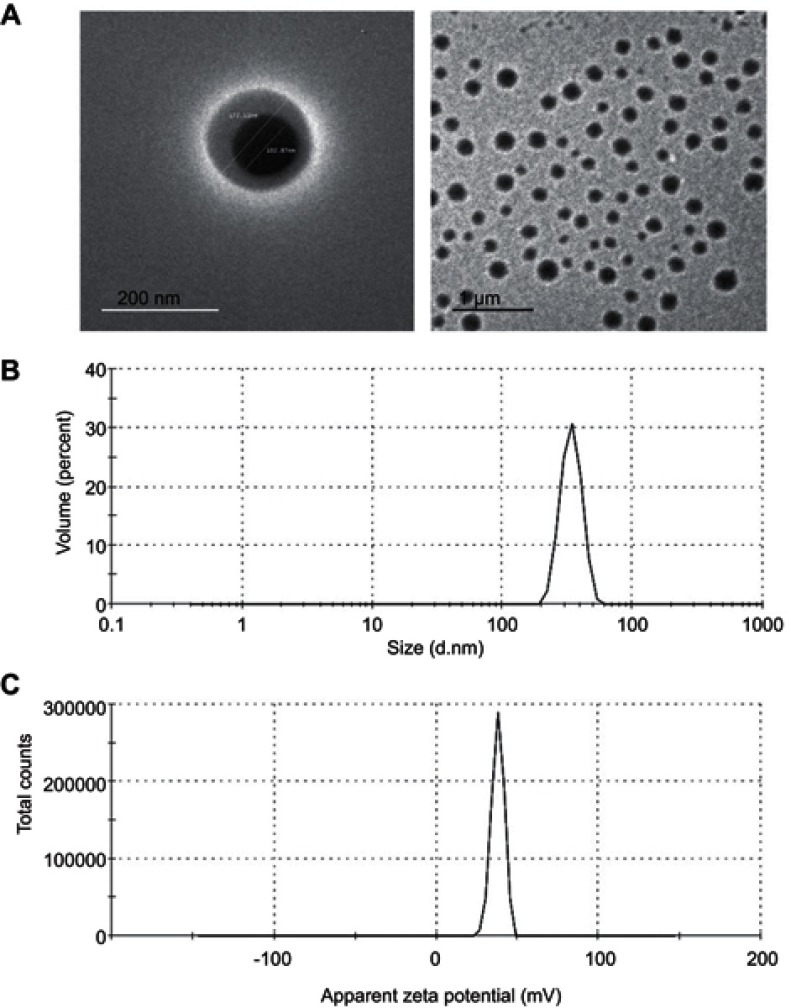
Figure 3.
TEM images, size and ZP distribution curves of APO-loaded COS-NPs (F4).
Notes: (A) TEM images with different magnifications, (B) size distribution curve, and (C) ZP distribution curve.
Abbreviations: APO, apocynin; COS, chitosan oligosaccharide; NPs, nanoparticles; TEM, transmission electron microscopy; ZP, zeta potential.

